
Ethereum ($ETH) price is currently trading around $2,520, showing signs of short-term recovery after a sharp hourly dip earlier this week. With strong historical resistance at $2,750 and bullish momentum from the $2,200 zone, investors are wondering: could Ethereum price touch $3,000 or even aim for a new all-time high in June 2025? Let’s analyze the charts and technical levels to understand where $ETH may be headed next.
Ethereum Price Prediction: Is Ethereum Building a Strong Base Above $2,200?
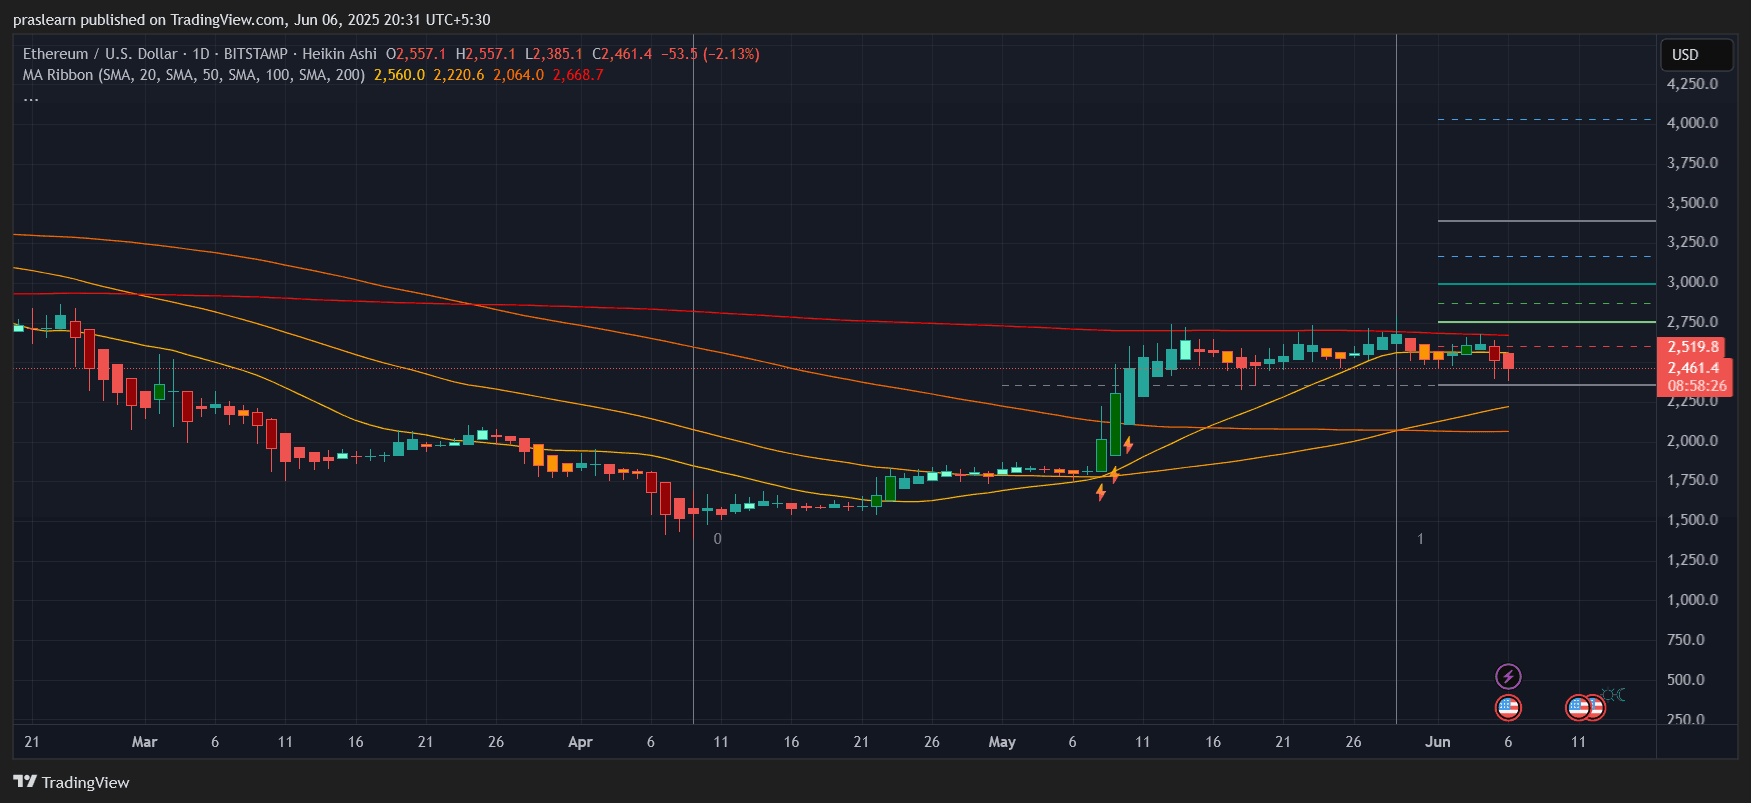
On the daily chart, Ethereum price made a clean breakout from its months-long sideways consolidation in early May. The breakout came with high momentum and was supported by a golden crossover of the 50-day SMA crossing above the 100-day SMA. This bullish alignment helped $ETH rally from around $2,200 to a local high near $2,750.
However, after hitting that resistance band (which also aligns with the 200-day moving average around $2,668), $ETH price faced rejection. The price has since corrected back to $2,461 as of June 6, a 10% dip from recent highs.
Despite the pullback, $ETH price has not breached the rising 50-day moving average at $2,220, which is now acting as critical support. As long as this support holds, the medium-term bullish structure remains intact.
What Does the Hourly Chart Reveal About Short-Term Sentiment?
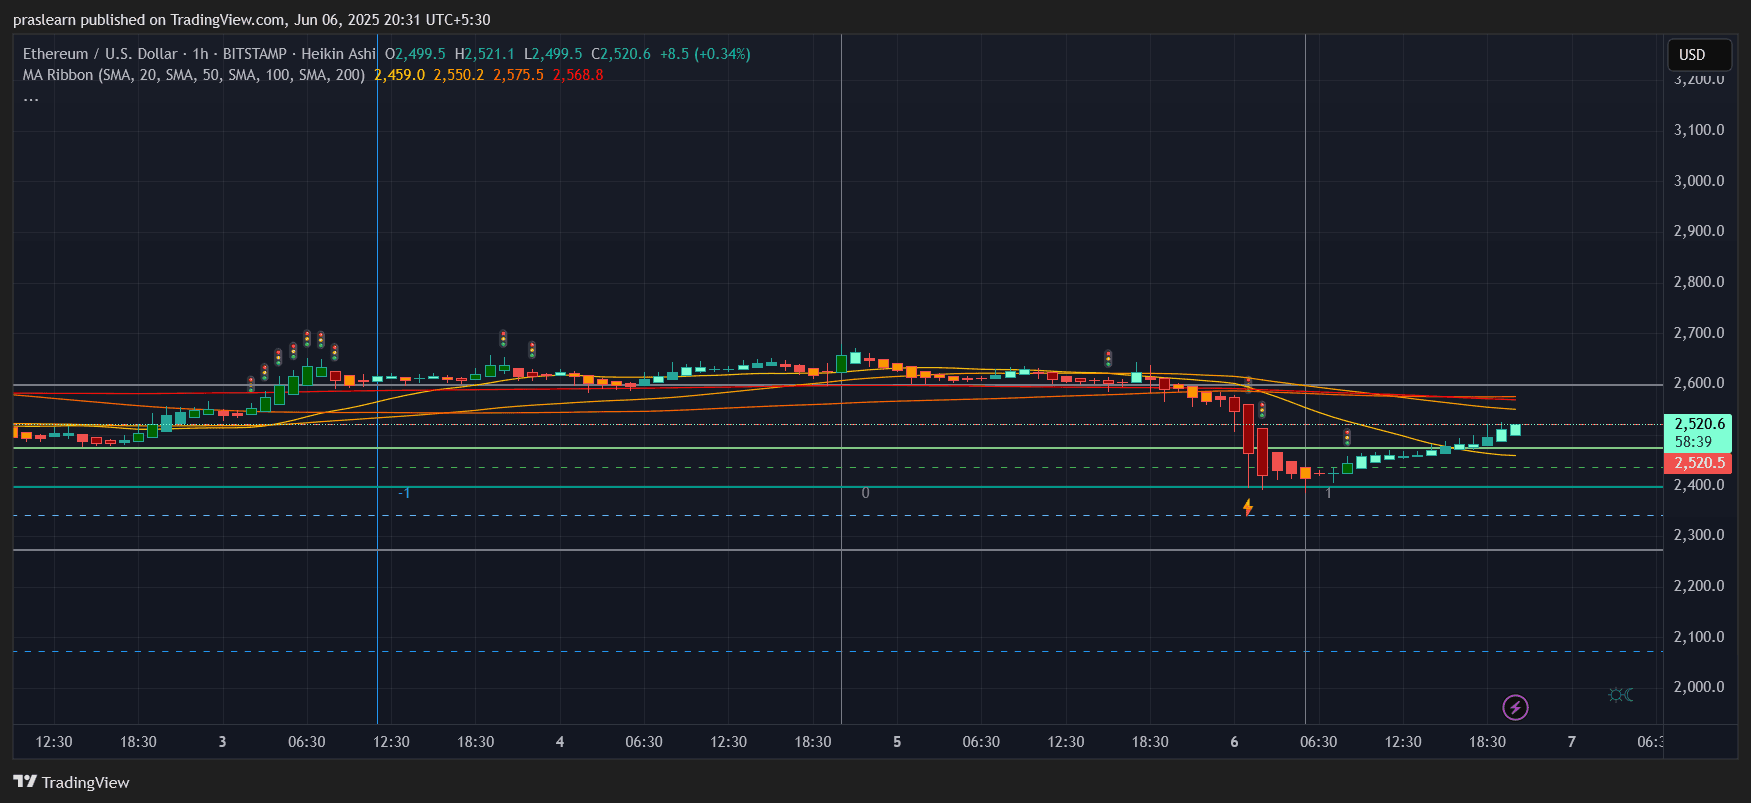
The hourly chart paints a picture of high volatility and fast-moving sentiment. On June 6, $ETH plunged sharply from around $2,600 to a low near $2,385. This move triggered panic among short-term traders, but the rebound was equally swift, pushing $ETH back toward the $2,520 level by the next session.
This V-shaped recovery is notable. It shows that buyers stepped in aggressively near the 50% Fibonacci retracement level of the May rally ($2,385 being close to halfway between $2,200 and $2,750). This suggests dip-buying interest remains healthy, especially from institutions watching these key zones.
With $ETH price now consolidating below the $2,575–$2,600 short-term resistance zone, a clean breakout above this range could unlock a rally toward the $2,750 mark again.
Fibonacci Levels Say $3,000 Is Within Reach
Using Fibonacci extension from the May breakout (swing low at $2,200 to high at $2,750), we get the following key levels:
- 1.618 extension ≈ $3,300
- 1.272 extension ≈ $3,000
This suggests that if Ethereum price breaks the $2,750 level convincingly, the rally could extend toward $3,000–$3,300, which would mark a significant bullish continuation. For context, $ETH's all-time high in the last bull cycle was around $4,800, meaning the coin still has room to run if macro and ETF sentiment turn favorable.
What Could Push $ETH Price to New Highs in June?
On June 6, 2025, BlackRock made headlines once again with a fresh $34.7 million Ethereum ($ETH) purchase, adding to its earlier $48.4 million acquisition just days prior. These back-to-back transactions, involving over 28,000 $ETH in total, underscore a calculated accumulation strategy rather than short-term speculation.
When a traditional asset titan like BlackRock makes repeated high-value entries into Ethereum, it sends a powerful market signal: institutional confidence is rising. This strategic averaging across multiple tranches—ranging from 9,000 to as much as 58,000 $ETH—suggests long-term positioning ahead of potential bullish catalysts like Ethereum ETF approvals or macro-driven demand shifts.
From a price analysis standpoint, institutional buying near the $2,400–$2,500 range builds a strong demand floor, making it less likely that $ETH will revisit sub-$2,200 levels without major systemic risk. Instead, the inflow from BlackRock could act as a springboard, fueling momentum toward the $2,750 resistance and possibly unlocking a breakout toward $3,000 in June. If this buying trend continues, it may even accelerate Ethereum’s path to new cycle highs.
Ethereum Price Prediction: What’s Next for June?
Based on current momentum and the structure of the daily and hourly charts, here’s a realistic forecast:
- Bullish scenario: $ETH breaks above $2,750 and targets $3,000–$3,300 based on the 1.272 and 1.618 Fibonacci extensions.
- Neutral scenario: $ETH consolidates between $2,400 and $2,750 for a few more days before making a directional move.
- Bearish scenario: A breakdown below $2,200 could invalidate the bullish trend, exposing $ETH to a retest of $2,000.
Probability-wise, as of now, the bullish-to-neutral case dominates based on the strong recovery from the dip, the moving average support at $2,220, and healthy demand in the $2,400 zone.
Final Thoughts
Ethereum price is in a decisive zone. After a strong breakout in May and a healthy dip-buy response, all eyes are now on the $2,575–$2,750 resistance zone. If bulls can clear this hurdle, a run toward $3,000 in June is not just possible—it’s probable.
For now, traders should watch for a clean close above $2,575 on strong volume and be cautious of any dips below $2,200. Ethereum’s technical structure remains promising, and its next move could shape the rest of the altcoin market this summer.
$ETH, $Ethereum