This comment was made in light of what the analyst called a real bullish action, coupled with really high volume in the past few days. This, in turn, confirms a very strong high in the coming weeks and days, where Ethereum will grow daily non-stop for months.
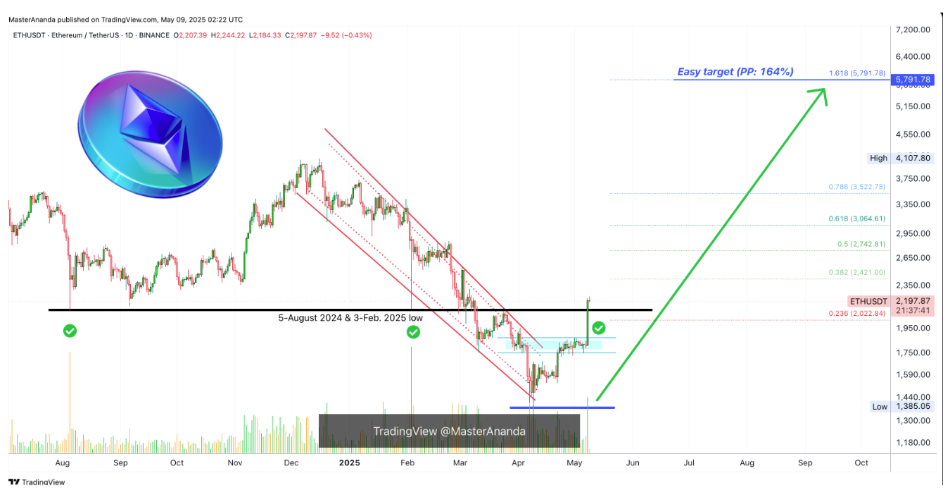
The recent rally has taken the price above the August 5, 2024, and February 3, 2025 lows, highlighted on a chart posted by the analyst on TradingView. The chart also shows that Ethereum broke free convincingly from a steep descending channel pattern that had trapped its price for months.
The breakout is convincing because a large green candle accompanied by unusually high trading volume marked the breakout, lending credibility to the view that the bear phase is now over.
“This is only the start,” the analyst wrote, adding that Ethereum’s path toward reclaiming its all-time highs is already underway.
 $5,791 An ‘Easy’ Target, $10,000 Before 2026 ‘Doable’
According to MasterAnanda’s analysis, the current rally could easily carry Ethereum to the 1.618 Fibonacci extension level near $5,791.78. He describes this target as “easy”, given the strength of the breakout and the capital inflow that appears to be building behind it.
Reaching the $5,791 price target would translate to a breakout to uncharted price territories above Ethereum’s current all-time high of $4,878. However, the prediction doesn’t stop there. A $10,000 Ethereum is not only possible but likely before the end of 2025 due to institutional money and retail sentiment flooding into the market.
The chart illustrates Ethereum’s recovery path with various Fibonacci levels mapped out, showing resistance and retracement points ranging from $2,421 at the 0.382 extension up to $5,791 at the 1.618 extension.
The analyst noted that around $250 billion in capital could eventually flow into the crypto market during this wave, with $10 to $15 billion already in play. He argues that the euphoric phase will begin once the remaining capital enters.
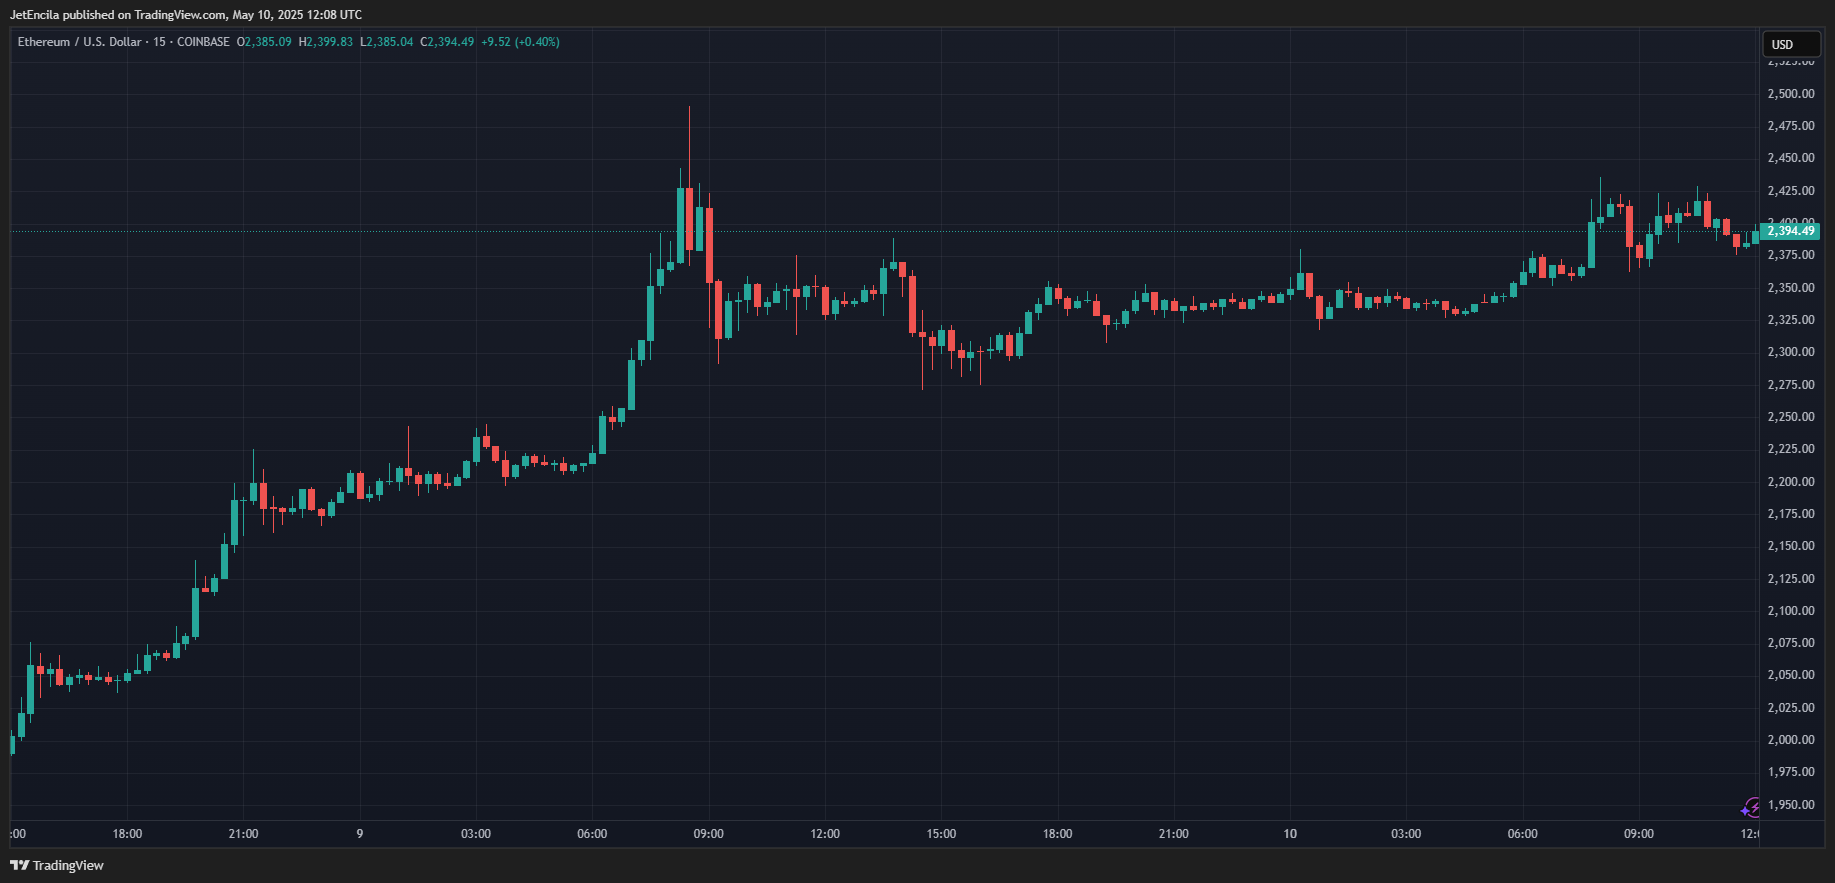
At the time of writing, Ethereum is trading at $2,395.
Featured image from Unsplash, chart from TradingView

 newsbtc.com