
In recent months, Ethereum ($ETH) has felt heavy bearish pressure. Falling from over $4,000 in December 2024 to current levels near $1,572, almost a 60% decrease in price. It has formed a descending channel on the daily chart, which indicates that downward momentum continues.
While volume has fallen 33.25% in the last 24 hours, $ETH price has increased by 4.288% in the same period. Is Ethereum gearing towards recovery, or will the bearish forces continue to dominate?
Ethereum Price Analysis
The price action shows a very long downtrend, beginning in December 2024. After reaching highs around $4,000, $ETH has continuously fallen, at present standing at $1,572. That represents a decline of about 60% within four months. The descending channel makes it abundantly clear how strong selling pressure has been for the past few months.
$ETH’s price is testing the lower boundary of the descending channel, with the price finding temporary support near $1,422 (0 Fib level).
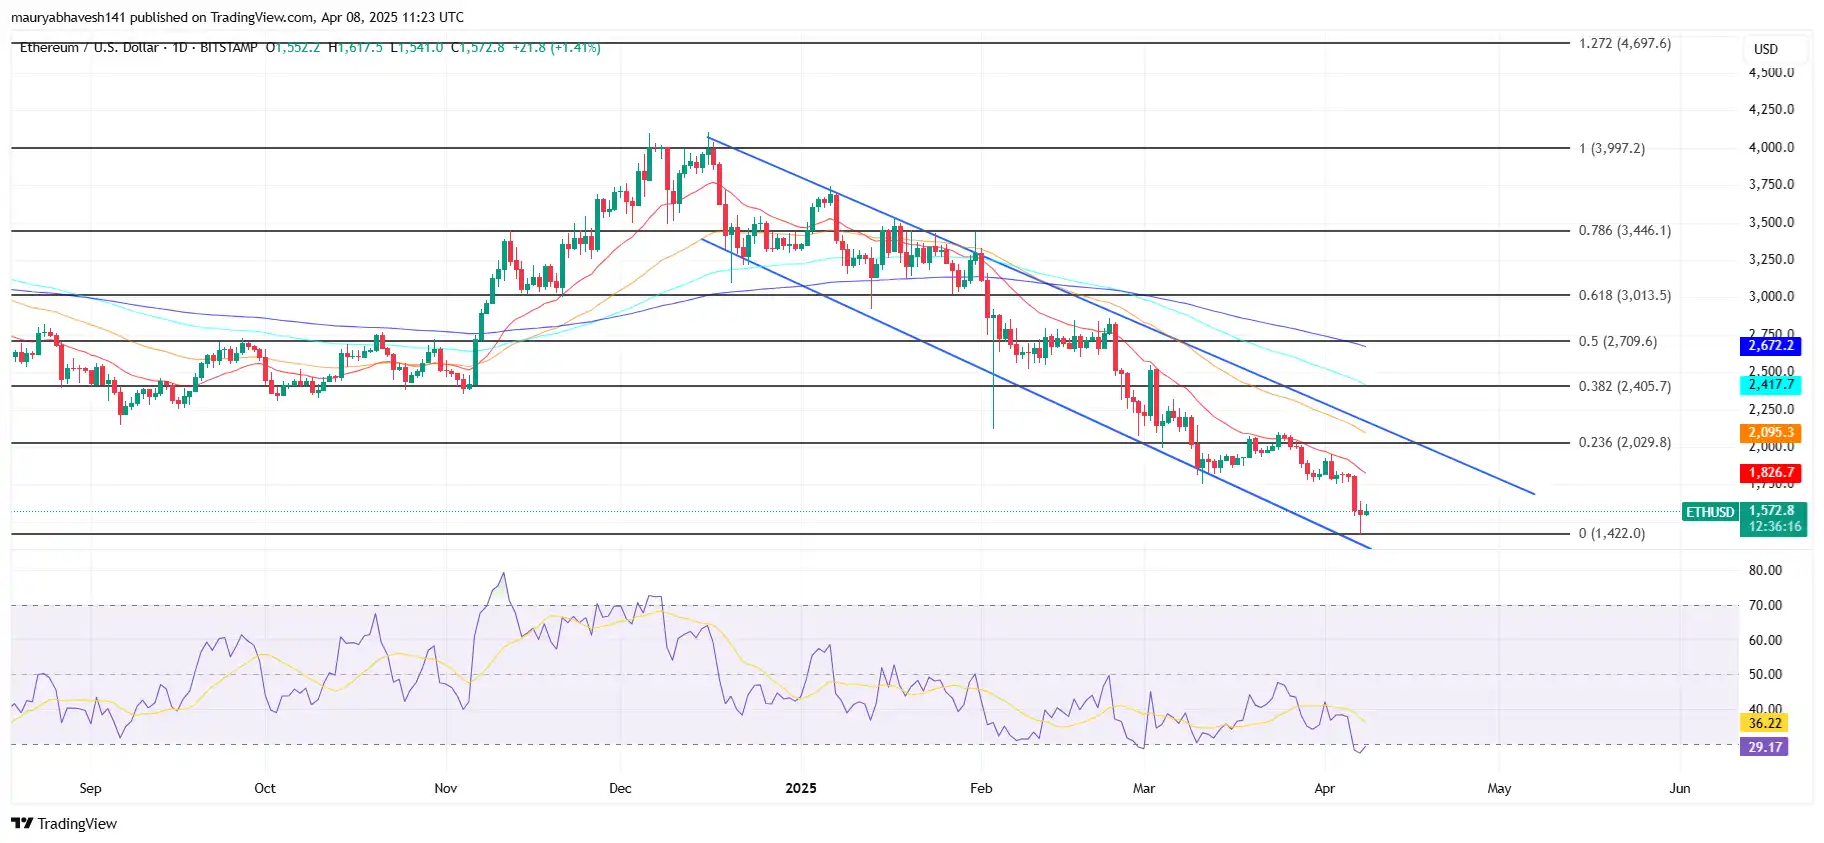
EMAs are declining, proving that the market structure has a bearish trend. Shorter-duration EMAs rest below, therefore, underlining stronger bearish momentum. Currently, $ETH trades under all the major moving averages.
The RSI sits around the 28.37 level indicating $ETH is in oversold conditions. Despite oversold levels, buyers are timid to approach aggressively hence suggesting a reserved sentiment in the market. Nevertheless, as soon as the broader market improves, this oversold status may clear possible conditions for a rally.
Ethereum has moved along a well-defined descending channel since December 2024. Prices have clearly rejected rally attempts at the upper boundary while the lower boundary has on a number of occasions seen price support. The present price action is testing this lower boundary at around $1,550 in what has become a critical level at which price could either break down or bounce back.
Key resistance levels are attained between the following Fibonacci levels $2,029 (0.236 Fib level), $2,405 (0.382 Fib level), and $2,709 (0.5 Fib level). Immediate support is at $1,422 (0 Fib level), which is exactly at the lower boundary of the descending channel. A breach below this level will likely trigger escalated selling pressure.
$ETH Price Targets
Bears face immediate resistance at the 0.236 Fib level ($2,029) as the first hurdle to overcome. A successful break above this mark has the potential to target the psychologically $2,500 level, near the 0.382 Fib level.
If $ETH breaks below the lower boundary of the channel and this falls below the $1,422 support, we can expect it to go further down to $1,200, which is another 24% loss from present levels.
Ethereum Whale Movement Triggers Concern
The $ETH market saw intense liquidation pressure after a major Ethereum price drop. A whale lost 67,570 $ETH, and it is worth around $106 million. It happened due to liquidation on Maker, following the sudden Ethereum price crash.
The investor, “7 Siblings,” had recently bought 24,817 $ETH for roughly $42 million, pushing their total holdings to over 1.2 million $ETH, now valued at approximately $1.9 billion.
Since February 3, this whale has purchased about 103,543 $ETH at a total cost of $230 million. Currently, they are facing a loss of $64 million on those positions. Whale movement like this has raised concerns in the crypto space, as large-scale investors typically have a significant impact on market sentiment and price action. Crypto news today continues to follow their activity closely.