Sell-side pressure over the past two days has seen the price of Ethereum dip below key support at the $160 level. Currently, the second-largest cryptocurrency by market cap is priced at $159. But has fallen 8% from its recent high just two days ago.
This move reversed an uptrend that peaked at $173 following the so-called “Black Thursday” crash. What’s more, the rejection has also seen Ethereum fall back below the ever-important 200-day simple moving average on the daily chart, seen below.
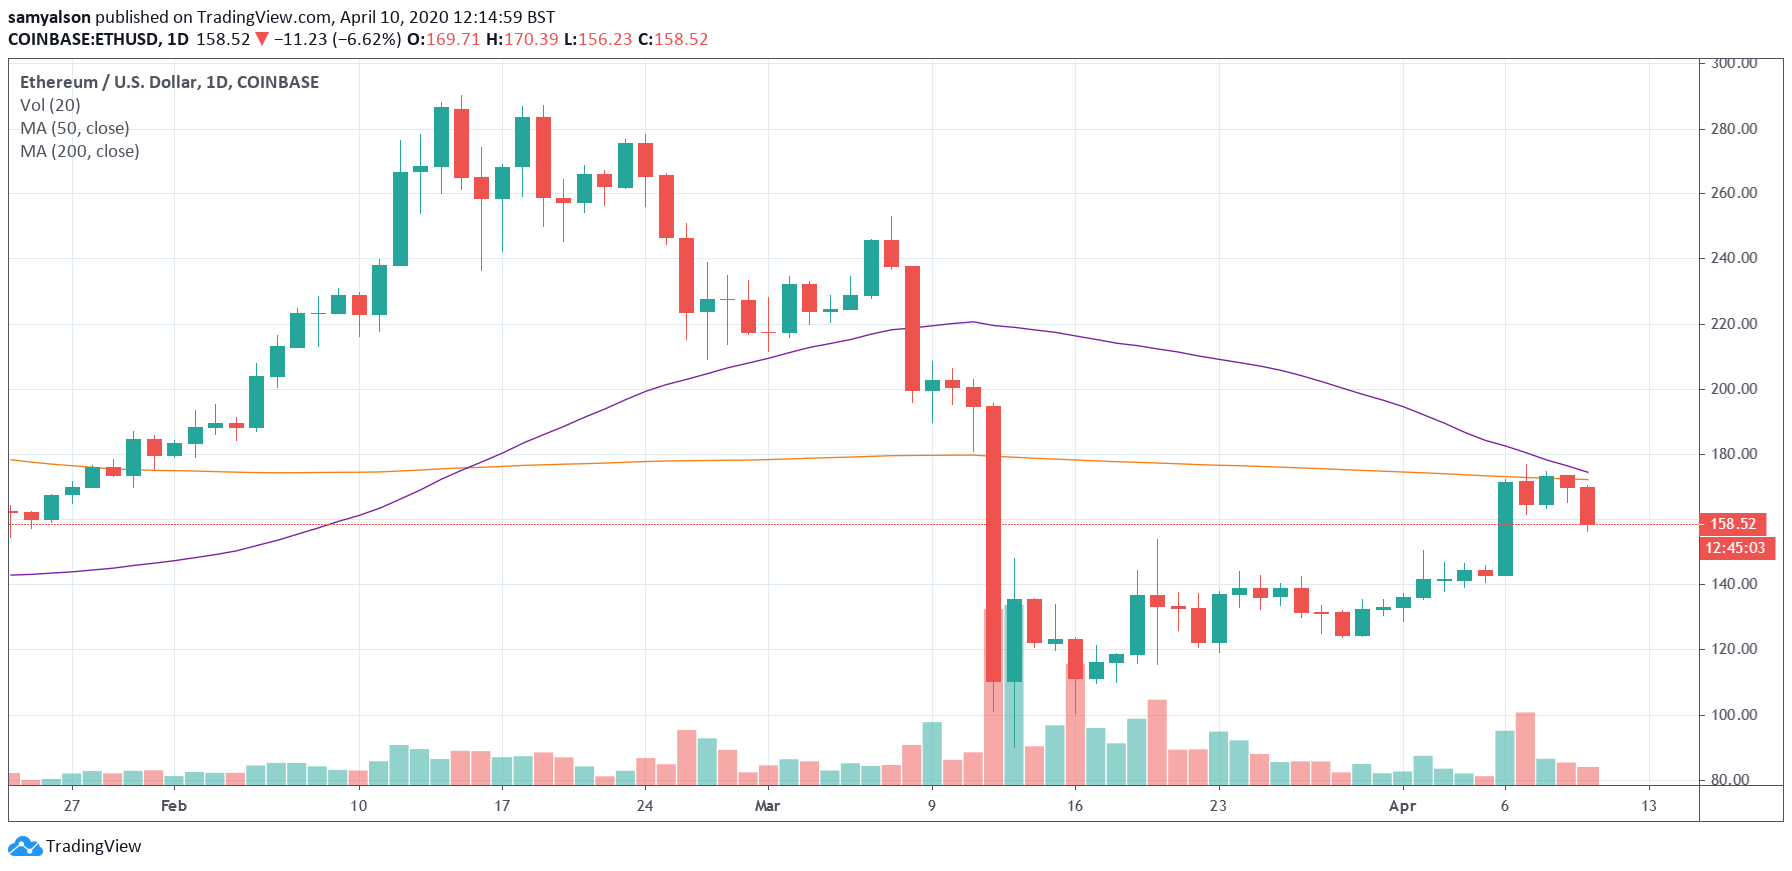
Ethereum daily chart showing 50-day and 200-day moving average. (Source: tradingview.com)
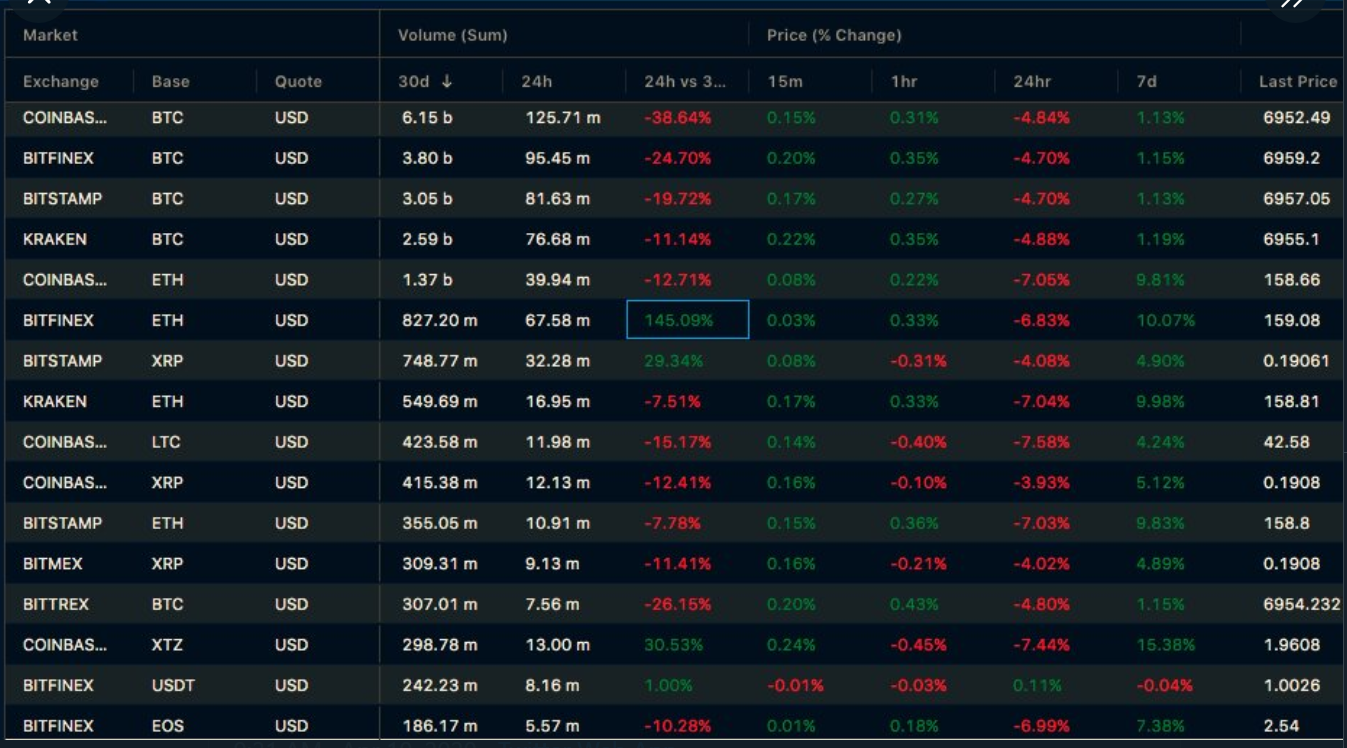
Indeed, in line with this bearishness, crypto-asset trader @cyrii_MM noted unusual activity on Bitfinex’s ETH/USD market. Data shows a huge 145% increase in the 24-hour price versus the 30-day price.
Back on March 10th, Ethereum was trading significantly higher having closed at just under $200. As such, a positive price percentage change on falling price points to the possibility of sell pressure building.
Is an Ethereum Price Dump Incoming?
On that note, the CEO of Three Arrows Capital, Su Zhu also noticed an unusually large ETHUSD buy wall on Bitfinex. To which he also drew attention to the ETHUSD volume ratio, at $72 million, closing in on BTCUSD, at $102 million. Which Zhu remarked as a further peculiarity, in that BTCUSD volume ratio normally significantly dominates that of any other alt pairing.
Large $ETH buy wall on bfx here, 200k ether filled and another 50k remaining in the order book pic.twitter.com/gK701gg6ws
— Su Zhu (@zhusu) April 10, 2020
Given the pattern of these events, some traders remain cautious of an Ethereum price dump in the near term.
Having said that, Ethereum’s fundamentals remain as strong as ever. For example, as previously reported, Glassnode, the analytics group, recently reported that Ethereum’s current market value to realized value (MVRV) ratio is presently undervalued.
Their latest research put the MVRV ratio at 0.8. Any score below 1 indicates undervaluation. Therefore, according to Glassnode, there is scope for the price to extend beyond the current market valuation.
“Ethereum’s MVRV Ratio, a metric used to assess if price is above or below ‘fair value’, currently sits at 0.8 – indicating that it is currently undervalued. ETH’s realized price is currently $202 while current market value is $164.“
BTC is Also Continuing to Dominate ETH
In line with short term bearish sentiment, Bitcoin also failed to crack key resistance at the next level up. Since its rejection at $7.4k yesterday, the market leader has been on a downward trend taking the rest of the market along it in fiat terms.
Also, in a further blow for Ethereum, an examination of the ETH/BTC daily chart shows Bitcoin dominance in force.
Despite an uptick on April 6th, which saw the price spike significantly above the 200-day moving average, Ethereum continues to struggle to maintain the upward trend. It closed down yesterday at 0.023, with a further decline today.
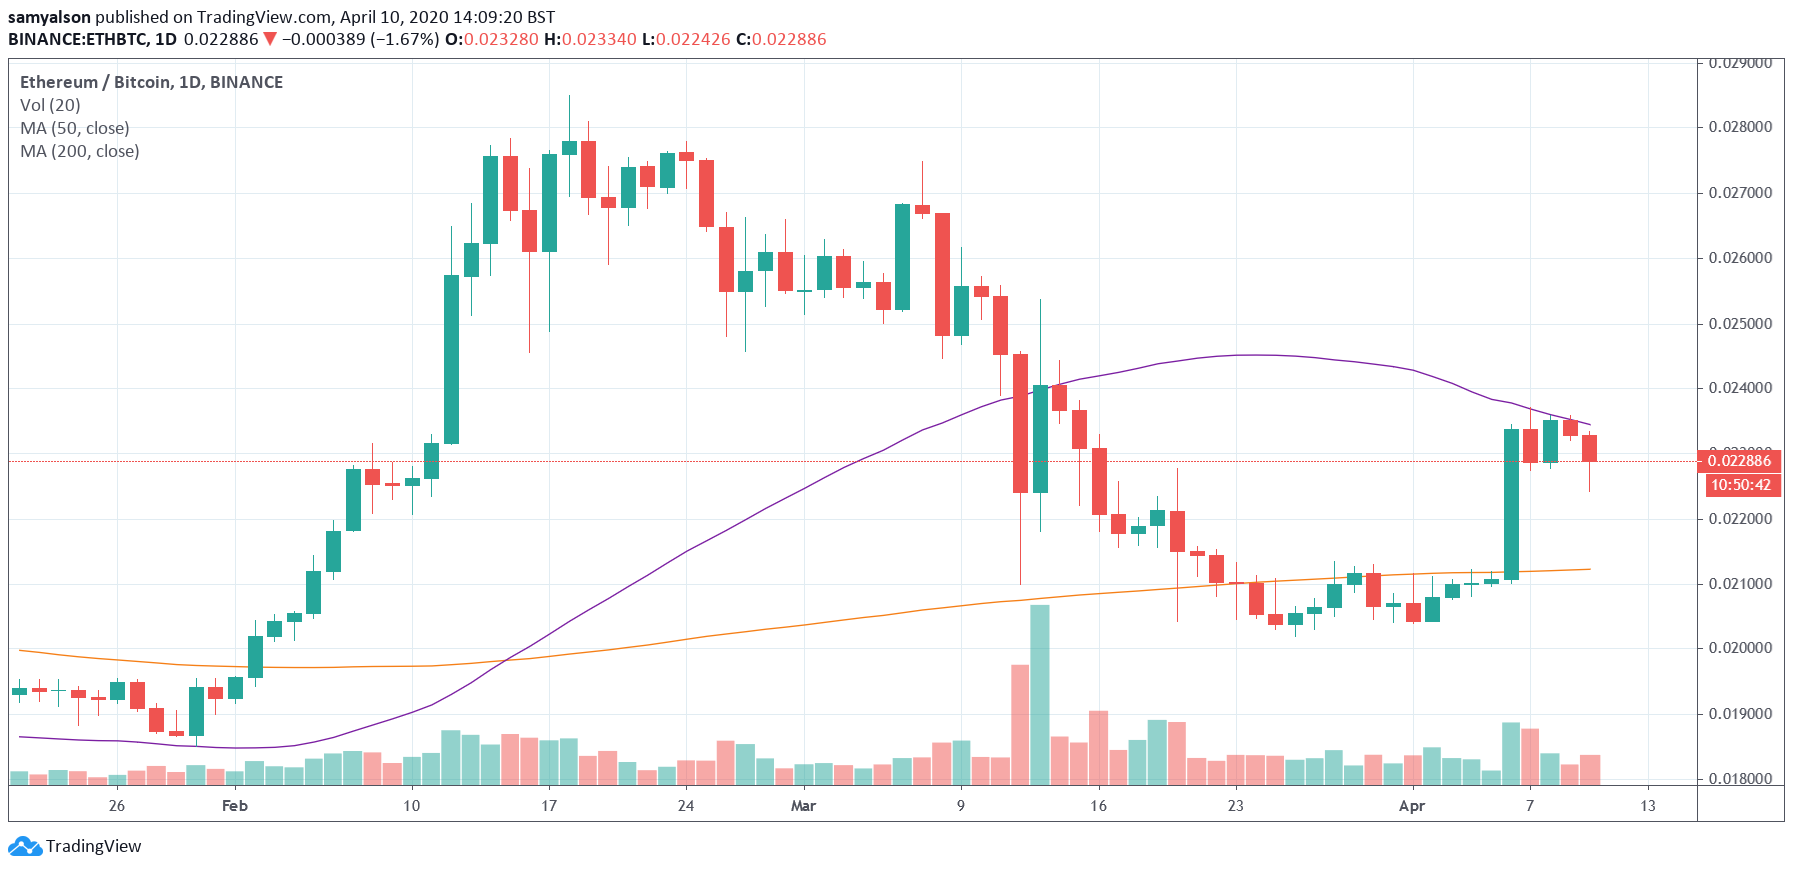
Ethereum Bitcoin daily chart with 50-day and 200-day moving average. (Source: tradingview.com)
All the same, the latest move is part of a larger downward trend, which sees Ethereum failing to regain its form prior to mid-February’s rally higher.
Featured Image from Unsplash