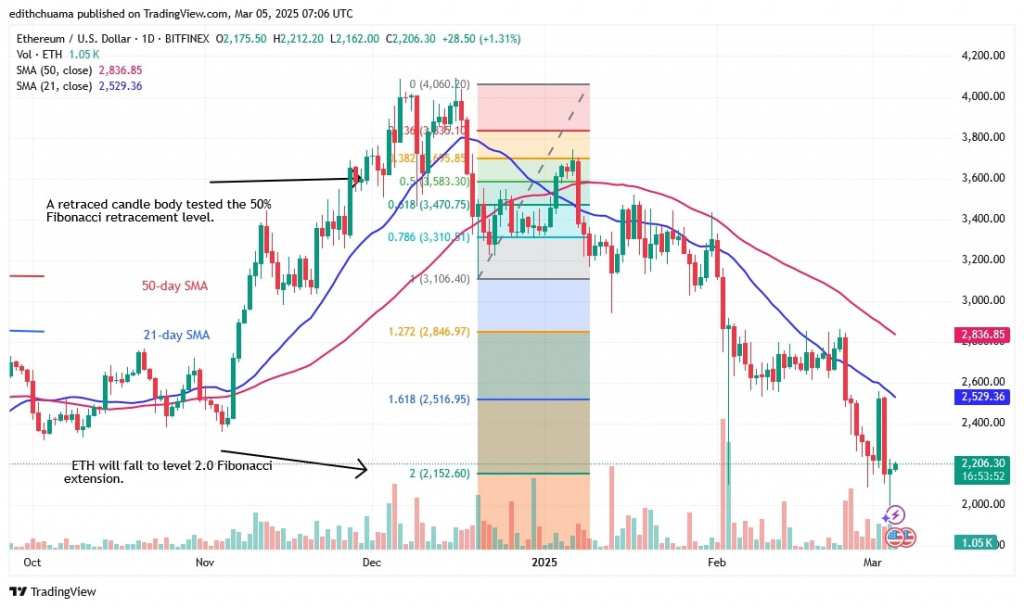
Still, Ether will turn negative if it falls off the 21-day SMA barrier. Or it will fluctuate between the support at $2,100 and the 21-day SMA barrier. Currently, $ETH is at $2,222, as Coinidol.com reports.
Analysis of the Ethereum indicators
Ethereum has fallen to the bottom of the chart. The negative trend has retraced after breaking below the $2,000 support. The price action is creating a long candlestick tail pointing above the $2,000 support. This indicates strong buying pressure above the $2,000 support. The downtrend of the moving average lines indicates a falling trend.
Technical Indicators:
Resistance Levels – $4,000 and $4,500
Support Levels – $3.500 and $3,000
What Is the Next Direction for Ethereum?
Ethereum has retreated after falling below the $2,000 support. Ether started a sideways movement and ended the downtrend on the 4-hour chart. The current price range for Ether is between $2,000 and $2,500.
The range-bound pattern was caused by the cryptocurrency's price being pushed back at the recent high on March 2. Ether will continue its rise once it crosses the $2,500 threshold.

Disclaimer. This analysis and forecast are the personal opinions of the author. They are not a recommendation to buy or sell cryptocurrency and should not be viewed as an endorsement by CoinIdol.com. Readers should do their research before investing in funds.

 coinidol.com