
During Friday’s U.S. trading hours, the crypto market witnessed a surge in selling pressure, evidenced by a long-wick rejection candle in Bitcoin. The overhead supply has plunged most major altcoins, including $ETH, which teases a breakdown below $2,500. While the market sentiment shows no signs of bottoming, the historical trend of Ethereum price signals recovery potential in February
Key Highlights:
- The Ethereum price correction could extend another 14% before the resistance key support trendline near $2,200.
- A bearish crossover between the 50-and-100-day exponential moving average should accelerate the market selling pressure.
- An ascending trendline in the daily chart marks the uptrend trajectory in $ETH.
Ethereum Price History Signals Optimism for Holders
Ethereum’s historical performance in February has often been strong, with notable gains in years like 2024 (+46.7%), 2023 (+1.14%), 2022 (+8.41%), and 2017 (+47.3%). This suggests that February has traditionally been a recovery month for $ETH, currently showing an average return of 28.8%, according to Cryptorank data.
However, the Ethereum price has recorded a 20.84% decline so far in February 2025, indicating the past performance does not guarantee an uptrend. Thus, the $ETH holders must also consider broader market sentiment before committing a view solely based on historical data.
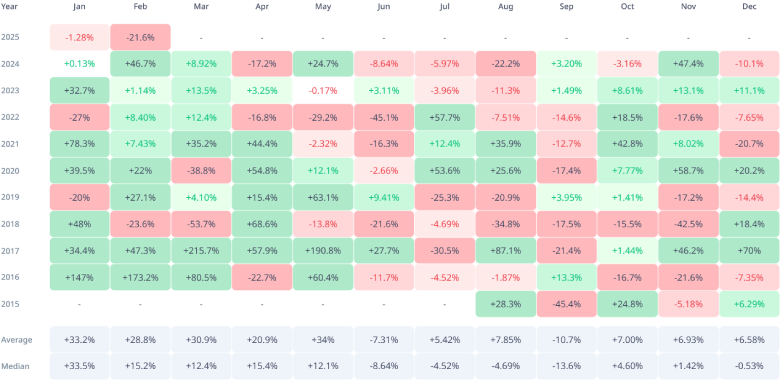
That being said, the Ether price shows higher odds of being successful in February. If history repeats, the coin price could rechallenge the $4,000 resistance.
$ETH Correction Nearing a Major Support Test
In the last two months, the Ethereum price has showcased an aggressive downfall from $4,108 to the $2,572 level, registering a loss of 38%. The falling price has recently breached a key support of $2,800, paving the way for sellers to prolong this current correction.
If the bearish momentum persists, the altcoin could plunge another 14% to test the long-coming support trendline at $2,200. This dynamic support has acted as a suitable support for dip buyers since June 2022, maintaining a sustained uptrend in $ETH.
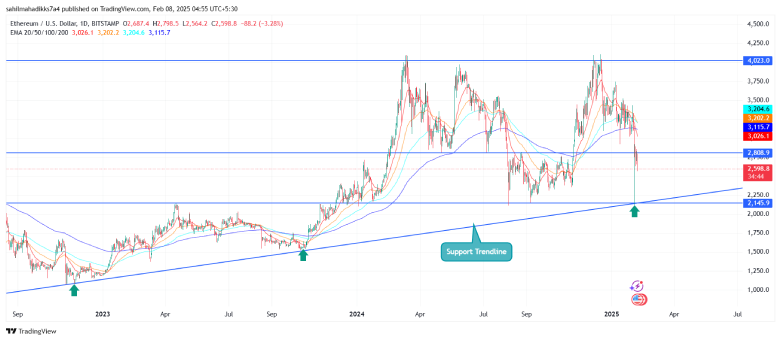
If history repeats, the coin price stalls its downtrend at the aforementioned trendline and prepares for the next recovery leap.