
Ethereum ($ETH), the second-largest cryptocurrency by market capitalization, continues to play a vital role in the blockchain ecosystem, serving as the foundation for decentralized finance (DeFi), non-fungible tokens (NFTs), and countless dApps. With its price recently encountering key resistance and support levels, traders and investors are closely monitoring $ETH's trajectory. In this analysis, we will examine Ethereum’s price chart, focusing on technical indicators and key market patterns, to determine what could be next for $ETH in the short to medium term.
How has the Ethereum Price Moved recently?
Ethereum is currently trading at $3,217, with a 24-hour trading volume of $23.06 billion. The cryptocurrency has a market capitalization of $386.66 billion, commanding a market dominance of 11.38%. Over the past 24 hours, the price of $ETH has dropped by 1.16%.
Ethereum achieved its all-time high price of $4,867.17 on November 10, 2021, while its all-time low of $0.420897 was recorded on October 21, 2015. Since reaching its peak, $ETH's lowest price has been $897.01 (cycle low), and its highest price since that cycle low was $4,094.18 (cycle high). The current market sentiment for Ethereum remains bearish, with the Fear & Greed Index indicating a value of 70 (Greed).
The circulating supply of Ethereum stands at 120.49 million $ETH, with a yearly inflation rate of 0.26%, equating to an additional 309,826 $ETH created over the past year.
$ETH Price Prediction: Chart Analysis
 $ETH Price Prediction">
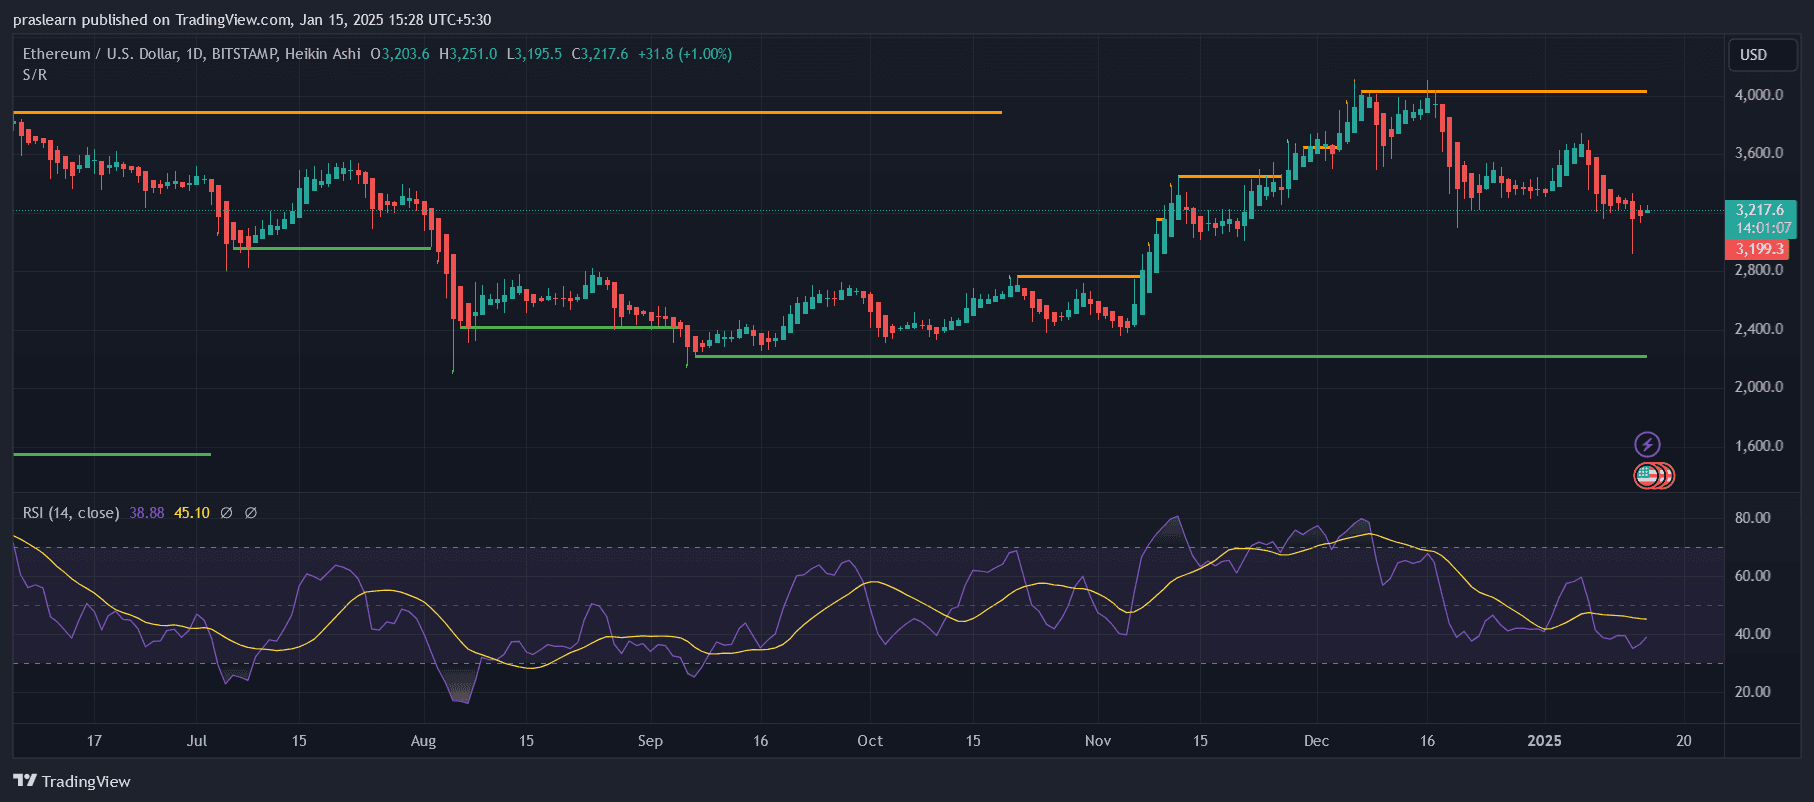
The daily chart reveals Ethereum trading around $3,217, recovering marginally from its recent low of $3,199. $ETH Price action has exhibited a clear rejection near the $4,000 resistance zone, marked by a horizontal orange line. Conversely, support at the $2,800 level (horizontal green line) has remained robust, forming a crucial floor for buyers.
Key Observations
Support and Resistance Levels
- Resistance Zones: The price failed to break above $4,000, reflecting strong seller interest at this level. This zone has acted as a critical ceiling in the last few months.
- Support Zones: The $2,800 mark has proven to be a reliable support level, providing a solid base for price recovery in earlier downtrends.
RSI Insights
- The Relative Strength Index (RSI) on the 14-day period hovers at 38.88, indicating oversold conditions. This suggests that the recent sell-off may be nearing exhaustion, potentially paving the way for a rebound.
- However, RSI's failure to cross above the midline (50) in the past reflects weak bullish momentum, which could delay a strong recovery.
Trend Momentum
- The price is currently below key moving averages, signaling a bearish bias in the short term. This aligns with the inability to sustain gains above the $3,600-$3,800 range.
- The Heikin Ashi candles show a lack of strong bullish momentum, with recent candles reflecting hesitation and bearish continuation.
What's Next for $ETH?
- Bullish Scenario If $ETH sustains above the $3,200 level and RSI begins to rise above 45, a potential breakout above $3,600 could occur. This move would likely target the $4,000 resistance level once again. A decisive breakout above $4,000 could signal renewed bullish strength, opening the path to $4,200 and beyond.
- Bearish Scenario Failure to maintain the $3,200 support could push $ETH back toward the $2,800 zone. If this support is breached, further downside is possible, with $2,400 being the next critical level of interest.
- Neutral Scenario $ETH could consolidate between $3,200 and $3,600 as the market digests recent price action. This range-bound activity may continue until a strong fundamental or technical catalyst emerges.
Conclusion
Ethereum's price currently sits at a pivotal juncture, with the market facing key support at $3,200 and resistance at $4,000. While the RSI indicates potential oversold conditions, signaling a chance for recovery, overall market momentum appears to lean bearish. Traders should closely monitor $ETH’s interaction with the $3,200 and $2,800 levels in the coming days, as well as broader market trends, including Bitcoin’s movement.
$ETH’s medium-term outlook hinges on breaking key resistance levels to rekindle bullish sentiment or maintaining critical supports to avoid a deeper correction. Stay alert to updates in the macroeconomic environment and Ethereum’s ecosystem developments, as these will influence the price trajectory significantly.