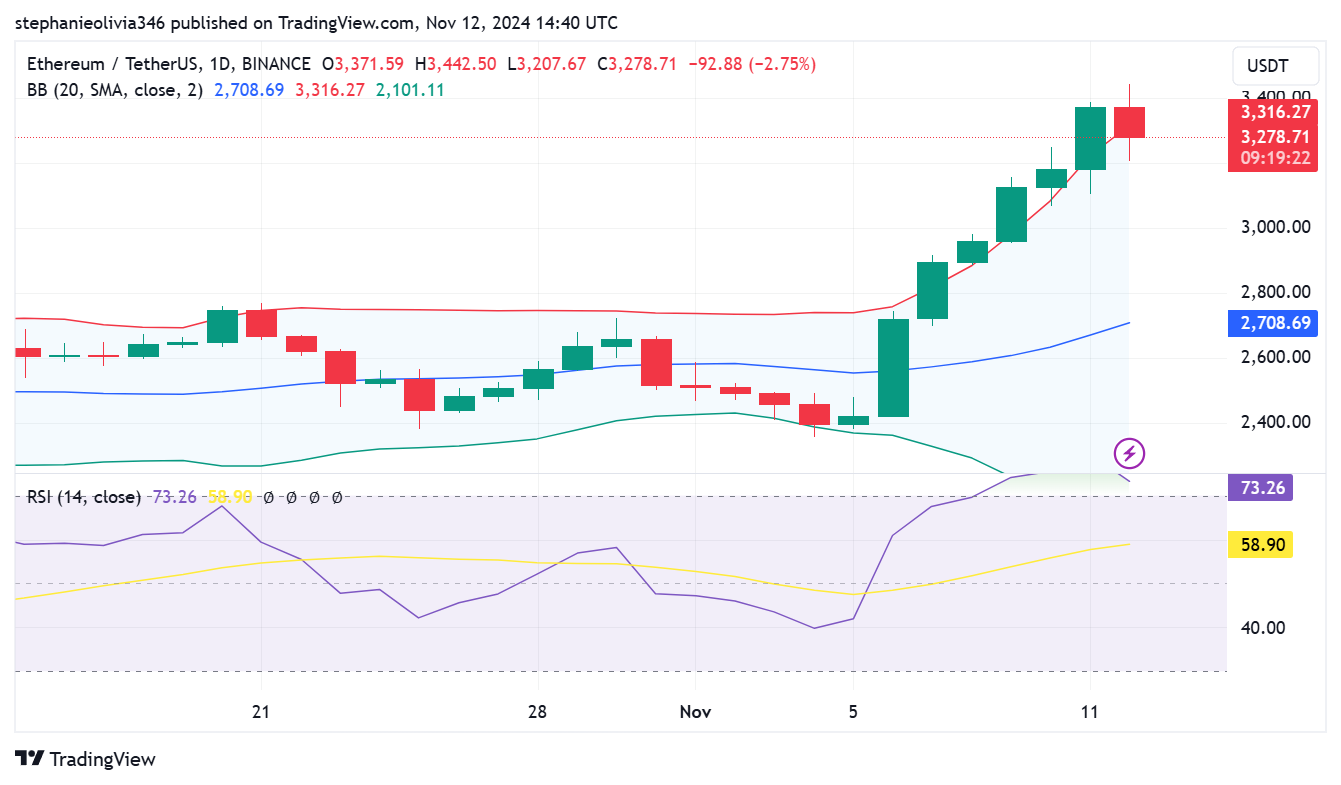
In the recent trading sessions, Ethereum has been trading higher. It has even reached the $3,400 level, which we can attribute to the start of the new uptrend.
However, technical indicators are indicating a short-term bearish trend in the market, though the long-term is bullish.
Despite this, analysts remain bullish in the long run. Some have set lofty targets of $6k targeting Ethereum. But at the same time acknowledging that Ethereum is likely to have to go through retesting at certain levels.
Strong Bullish Momentum with Overbought Signals
Ethereum price has been rising constantly in the last several days. This resulted in reaching the upper Bollinger Band, around $3,316.27.

Trading near the Upper Bollinger Band territory is usually considered to signal the presence of a strong bullish trend. Furthermore, it may suggest that the asset is overbought in the short term.
For that reason, we can expect Ethereum to briefly consolidate as it comes across resistance at a higher level. The Relative Strength Index (RSI) stands at the 73.26 mark.
It has already entered the overbought level above 70, suggesting increased bullish pressure. The price continues to surge and RSI continues to sit above the 70 level. And a pullback is likely to occur.
Ethereum Key Support Levels and Potential Consolidation
The middle Bollinger Band set at $2,708.69, which relates to the 20-day Simple Moving Average, can be an important support level if Ethereum retreads.
This middle band usually acts as the support level, and staying above it keeps the bullish outlook intact. Some of the levels that analysts consider buyers might re-enter are at this level if ETH continues to demonstrate strength in its recovery.
A drop below this middle band, however, could indicate increased bearish pressure, signaling that the asset’s recent uptrend may be weakening.
This support zone will be critical in determining whether ETH can maintain its current momentum or if a deeper correction is on the horizon.
Analyst’s Perspective: Ethereum Path To New All-Time High?
Crypto analyst ZAYKCharts also notes that the bulls have managed to break the Ethereum price out of the descending wedge on the weekly chart, suggesting more gains.
$ETH Following the plan,So Far🔥
— ZAYK Charts (@ZAYKCharts) November 12, 2024
New all time high soon ($6000)✍️#ETH #ETHUSDT #Ethereum #Crypto pic.twitter.com/14LisTse8w
While this pattern is considered by many as a bullish reversal signal, it may mean that Ethereum is on the way to reaching all-time highs.
This pattern, which is often seen as a bullish reversal signal, suggests that Ethereum could be on track to reach new highs.
Following ZAYKCharts suggest that Ethereum may climb to $6,000 by the end of the month if the breakout gains enough momentum.
This target represents a substantial 137% potential upside from current levels. ZAYKCharts explains that Ethereum is “following the plan so far,” which suggests optimism regarding the ongoing bullish sentiment.
The buying zone is green-highlighted on the chart and shows the possible path to $6000. That’s provided Ethereum manages to sustain the momentum. Ethereum can remain bullish as long as support holds above the breakout level on the chart.
Market Sentiment and Broader Crypto Rally
Ethereum’s rise has been coupled with the uplift in the rest of the cryptocurrency market following Bitcoin’s surge to over $90,000.
Avalanche, Dogecoin, Shiba Inu, XRP, and other significant altcoins have also shown steep price surge. This further proves the generally positive outlook in the market.
While Ethereum’s rally has been strong, some X (formerly Twitter) users suggest a pullback to around $3,000 may be likely in the near term.
 thecoinrepublic.com
