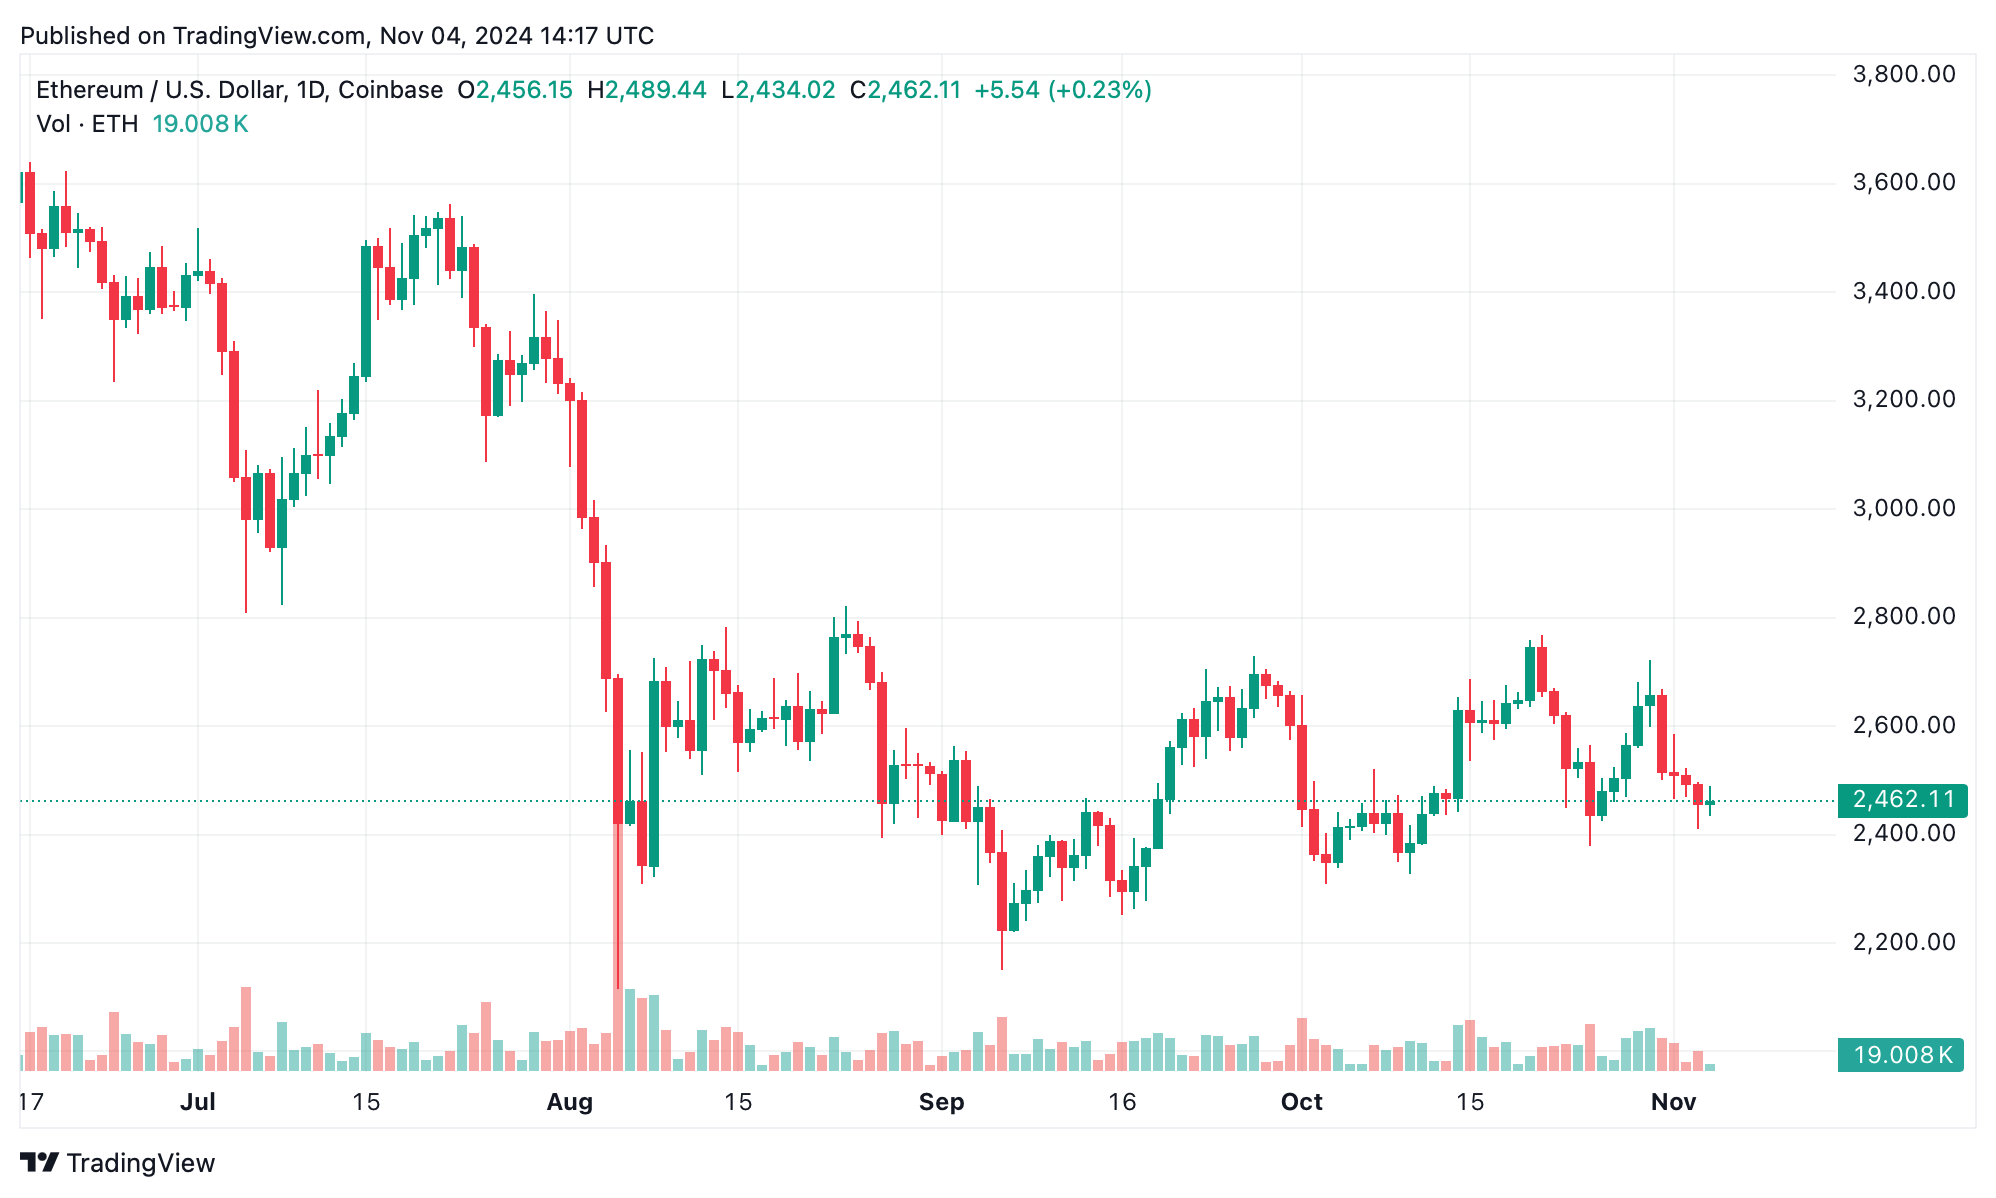
Ethereum (ETH) is currently hovering around critical support and resistance levels, with recent trading activity suggesting that a breakout or breakdown might be on the horizon.
Ethereum
Looking at the daily chart, ethereum (ETH) has trended downward since hitting a high of $2,769.4 in Oct. A consistent lineup of red candles underscores the selling pressure, with support clustering around the $2,410 mark, acting as a firm buffer against further declines. Resistance is evident between $2,550 and $2,600, matching past price highs. Trading volume has eased recently, which could hint at dwindling bearish enthusiasm—unless sellers reassert themselves to continue the trend.

On the 4-hour chart, ethereum is moving within a tight $2,410 to $2,500 range, reflecting a period of consolidation. This sideways pattern often leads to a more decisive price move—either breaking above resistance or dipping below support. Trading interest spikes during sharp price drops, though recent volume is low. A push above $2,500 might hint at a reversal, while a slip below $2,410 could signal continued bearish strength.

Switching to the 1-hour chart, ethereum shows modest attempts at upward movement, with recent highs at $2,490.2 failing to breach the $2,500 resistance level, which sellers continue to guard closely. The mix of red and green candles, along with low volume, indicates a hesitancy among traders, positioning $2,450 to $2,490 as a zone of stalling. A significant volume shift is needed to set ethereum on a decisive course from here.
Technical indicators reflect a neutral stance, with the relative strength index (RSI) at 43.4 and the stochastic oscillator at 23.5 showing no clear directional momentum. The commodity channel index (CCI) at -99.8 adds to the theme of indecision. However, the awesome oscillator at -13.0 and the moving average convergence divergence (MACD) at -11.0 lean bearish, while a slight upward nudge in momentum at 16.1 offers a faint buy signal.
Moving averages lean toward a bearish view. Short-term indicators like the 10-day exponential moving average (EMA) at $2,515.2 and the 10-day simple moving average (SMA) at $2,527.4 suggest selling pressure. This bearish sentiment extends across longer frames, with the 200-day EMA at $2,762.1 and the 200-day SMA at $2,963.7 reinforcing the downward trend. A reversal would need a move above these averages with sustained buying interest—currently absent.
Bull Verdict:
If ethereum breaks above $2,500 with strong volume support, the bullish sentiment may gain traction, potentially paving the way for a recovery toward the upper resistance levels near the 200-day moving averages. Traders watching for momentum might consider this breakout as a cue for upward movement, aiming to ride a shift in sentiment if buying pressure sustains.
Bear Verdict:
A decisive drop below $2,410, especially if accompanied by increased volume, would reinforce the bearish trend and signal a potential continuation of the downtrend. For traders eyeing short positions, a break below this key support could present opportunities to target lower levels, as ethereum’s consolidation period gives way to renewed selling momentum.
 news.bitcoin.com
