
Ethereum price today:$2,600
- Ethereum price finds support around its 50-day EMA at $2,538, suggesting a possible rally ahead.
- On Tuesday, US spot Ethereum ETFs recorded a mild outflow of $12.70 million.
- Lookonchain data and Sentiments Network Realized Profit/Loss show some investors are booking profits.
Ethereum (ETH) edges higher again on Wednesday after retracing and testing its crucial support level the prior day. Supporting Tuesday’s retracement, US spot Ethereum Exchange Traded Funds (ETFs) recorded a mild outflow on the day, followed by some investors booking profits, as shown by Lookonchain data and the Sentiments Network Realized Profit/Loss metric.
Ethereum investors selling their bags
US Ethereum spot ETF posted a mild outflow of $12.70 million on Tuesday, according to data from CoinGlass. Studying the ETF flow data can be useful for observing institutional investors’ sentiment toward Ethereum. If the magnitude of outflows increases and continues, demand for Ethereum will decrease, leading to a fall in its price.
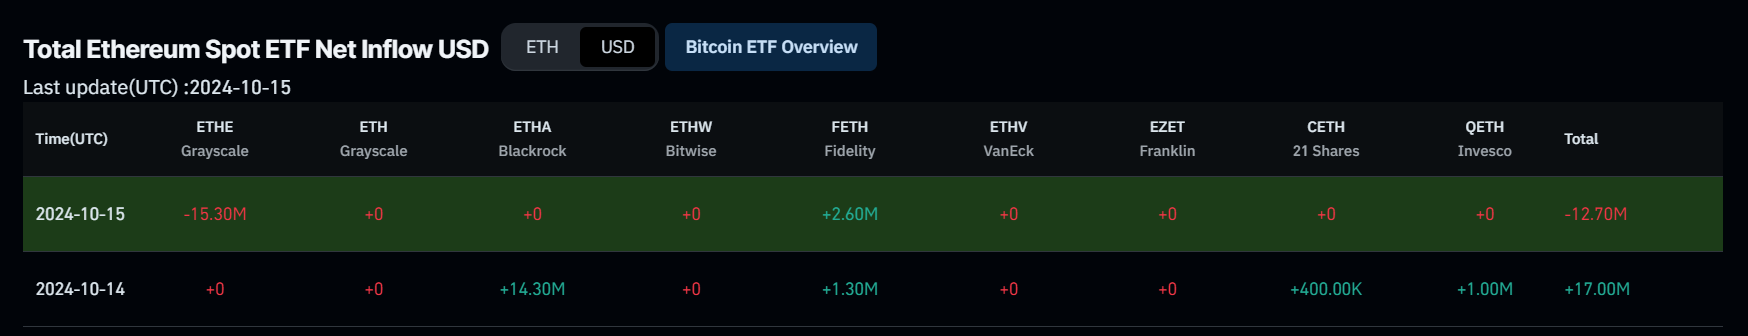
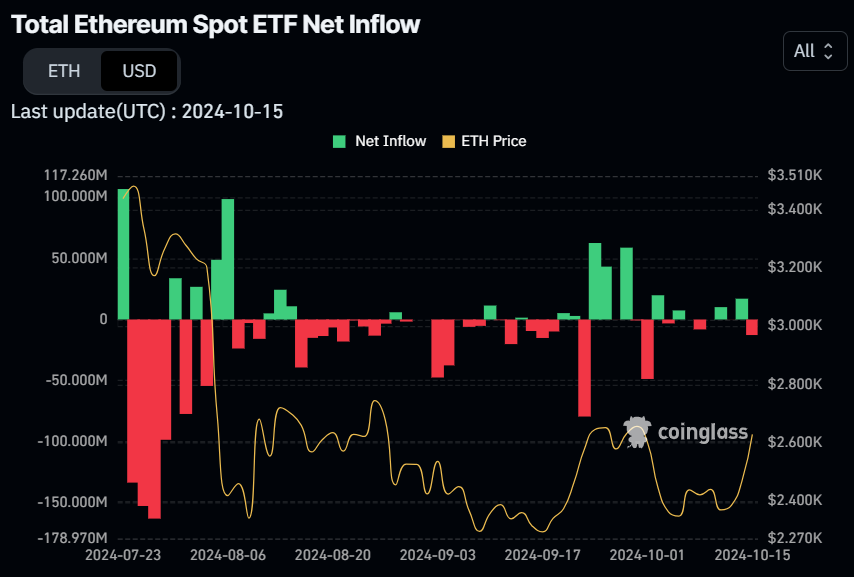
Total Ethereum Spot ETF Net Inflow chart. Source: Coinglass
On Tuesday, the Ethereum Foundation wallet sold 100 ETH worth $258,000. Additionally, another whale wallet sold all the remaining 4,802 ETH worth $12.56 million. The wallet bought 9,050 ETH in early September and sold them on September 30, October 2, and Tuesday, booking total profits worth $2.8 million.
The #EthereumFoundation sold 100 $ETH($258K) at $2,580 again 1 hour ago.#EthereumFoundation has sold a total of 3,966 $ETH($11M) at an average price of $2,765 this year.https://t.co/eZVq7QeY3O pic.twitter.com/uYwPrIgZxv
— Lookonchain (@lookonchain) October 15, 2024
myparagon.eth sold all the remaining 4,802 $ETH($12.56M) 40 mins ago, making a profit of ~$2.8M in 38 days!
— Lookonchain (@lookonchain) October 15, 2024
He bought 9,050 $ETH($20.75M) at ~$2,293 on Sept 7 and Sept 9.
Then he sold all $ETH at ~$2,598 on Sept 30, Oct 2, and Oct 15, making ~$2.8M.https://t.co/XFRkut6fb4 pic.twitter.com/jfBt8h8d0Q
The Sentiments Network Realized Profit/Loss (NPL) metric provides a clear picture of selling pressure. This indicator computes a daily network-level Return On Investment (ROI) based on the coin’s on-chain transaction volume. Simply put, it is used to measure market pain. Strong spikes in a coin’s NPL indicate that its holders are, on average, selling their bags at a significant profit. On the other hand, strong dips imply that the coin’s holders are, on average, realizing losses, suggesting panic sell-offs and investor capitulation.
In ETH’s case, the NPL indicator spiked from -8.82 million to 110.44 million from Sunday to Monday. This uptick indicates that the holders sold their bags for a significant profit. Although the intensity of selling pressure is low, traders must keep a watchful eye on the metric.
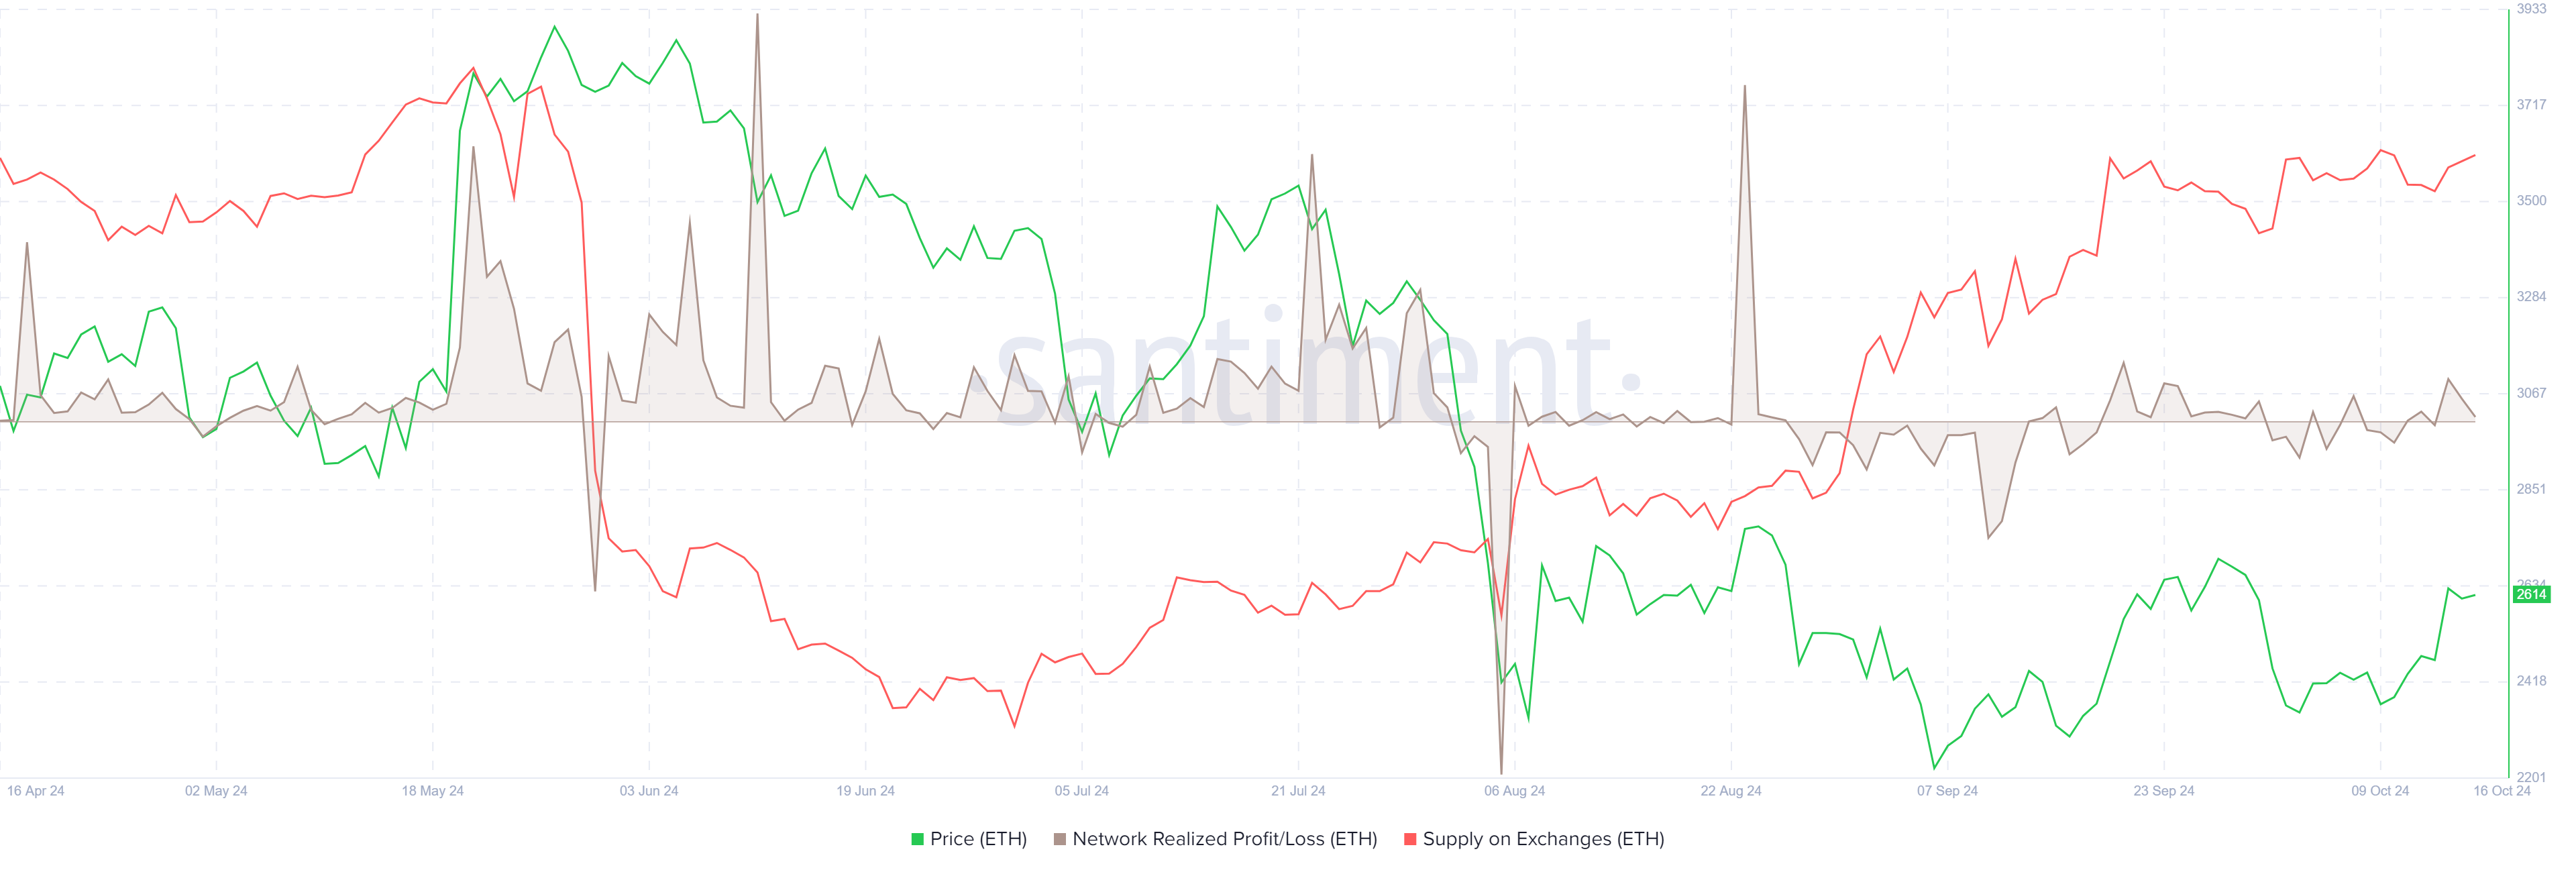
Ethereum Network Realized Profit/Loss chart. Source: Santiment
Ethereum Price Forecast: ETH finds support around 50-day EMA
Ethereum price broke above the daily resistance level of $2,461 and rallied 6.5% on Monday, closing well above its 50-day Exponential Moving Average (EMA). On Tuesday, ETH declined to test and find support around the 50-day EMA at $2,538. At the time of writing on Wednesday, ETH’s price edges higher and trades at around $2,600.
If the 50-day EMA at $2,538 continues to hold as support, ETH could extend the rally to retest its August 24 high of $2,820.
The Moving Average Convergence Divergence (MACD) indicator supports Ethereum’s rise, signaling a bullish crossover on the daily chart. On Monday, the MACD line moved above the signal line, giving a buy signal. It shows rising green histogram bars above the neutral line zero, also suggesting that Ethereum’s price could experience upward momentum.
Additionally, the Relative Strength Index (RSI) on the daily chart trades at 59, above its neutral level of 50, suggesting bullish momentum is gaining traction.
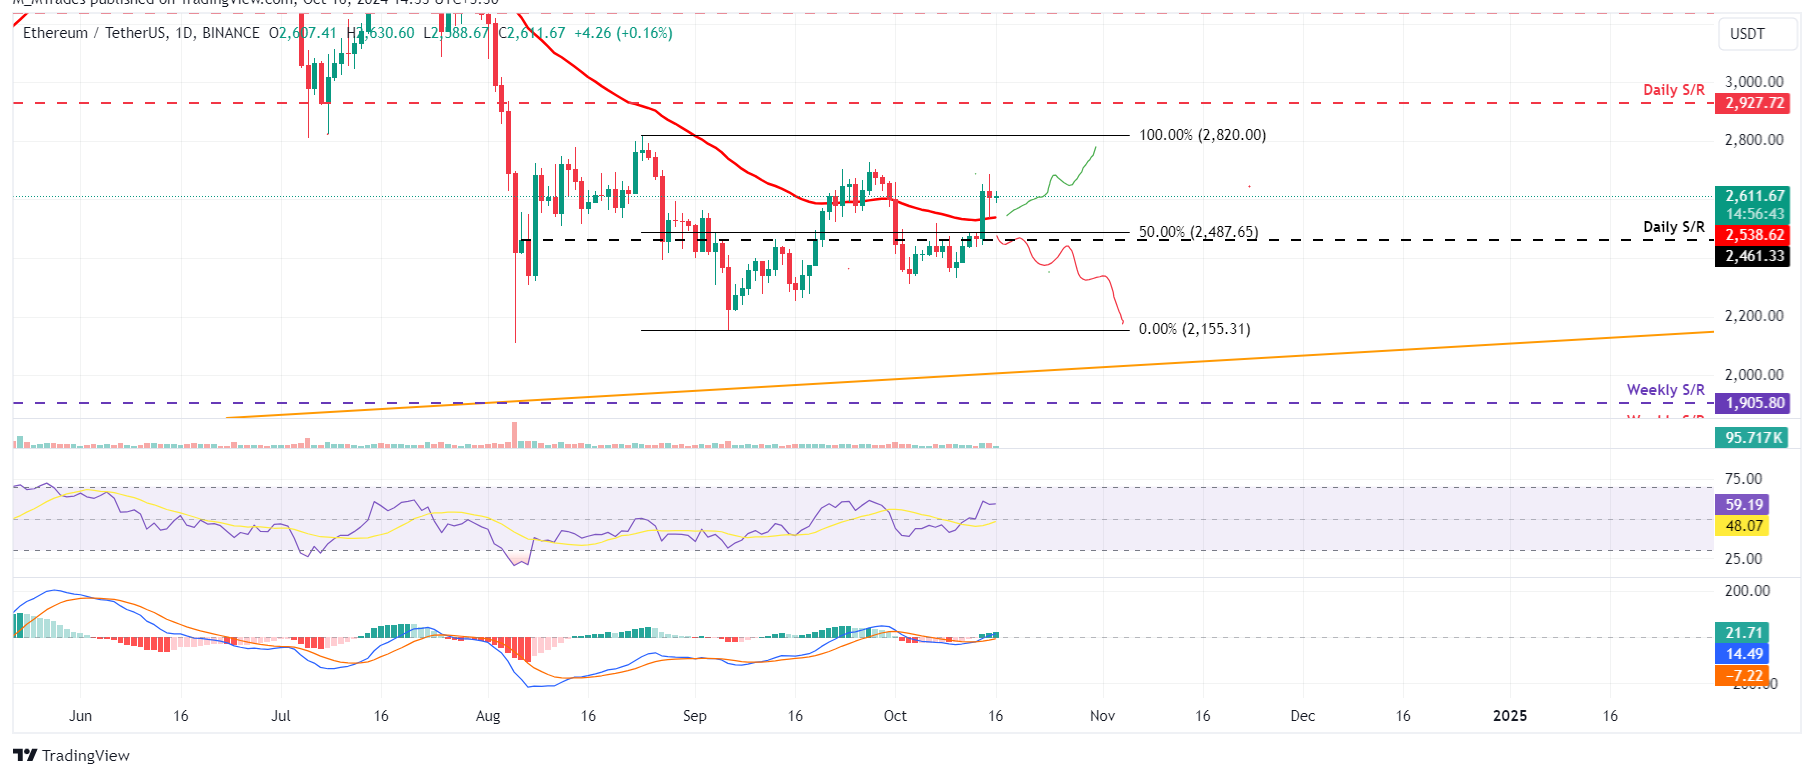
ETH/USDT daily chart
Conversely, if Ethereum’s price closes below the daily support level at $2,461, ETH could extend the decline by 13% to retest its September 6 low of $2,150.