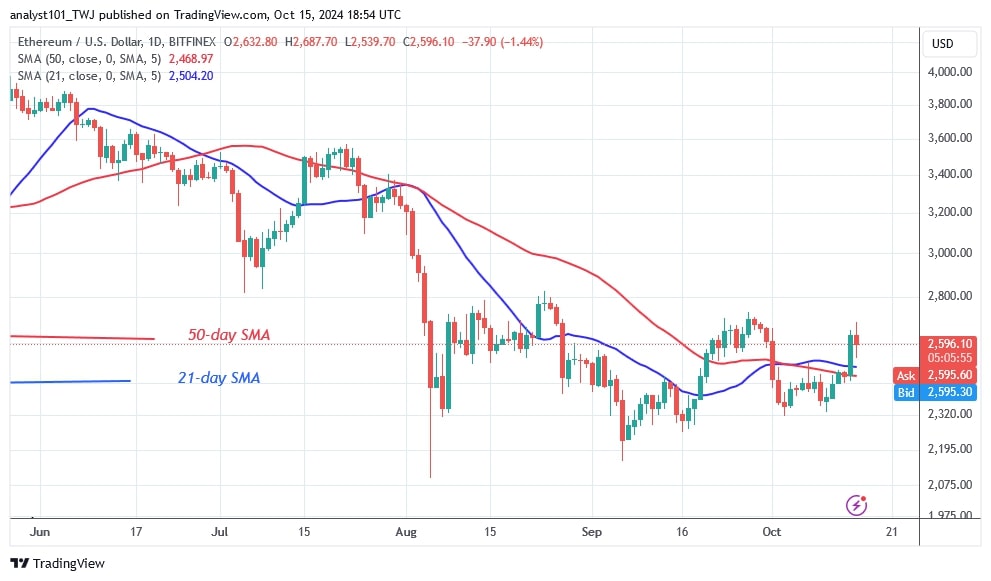
The price of Ethereum (ETH) rose above the moving average lines on October 14 and is trying to regain its upward momentum. The positive momentum peaked at $2,687 but then paused.
Ethereum price long-term analysis: bullish
The positive momentum also faded on September 27, when the altcoin fell below the moving average lines, as reported by Coinidol.com.
Today, the decline has stalled at the $2,500 support as the altcoin resumes its uptrend. Ether is expected to rise and retest or break through the $2,800 barrier. A break above the resistance level will signal the continuation of the positive momentum. If Ether loses the $2,500 support, the risk of a decline increases. The altcoin will test its previous low at $2,300. Today, the largest altcoin price is $2,615 at the time of publishing.
Ethereum indicator analysis
On October 14, the price bars returned above the moving average lines. The currency is dropping towards the 21-day SMA support. The current uptrend will continue if the 21-day SMA support holds. Ether will enter a downtrend if the moving average lines are broken.
Technical Indicators:
Resistance Levels – $4,000 and $4,500
Support Levels – $3.500 and $3,000

What is the next direction for Ethereum?
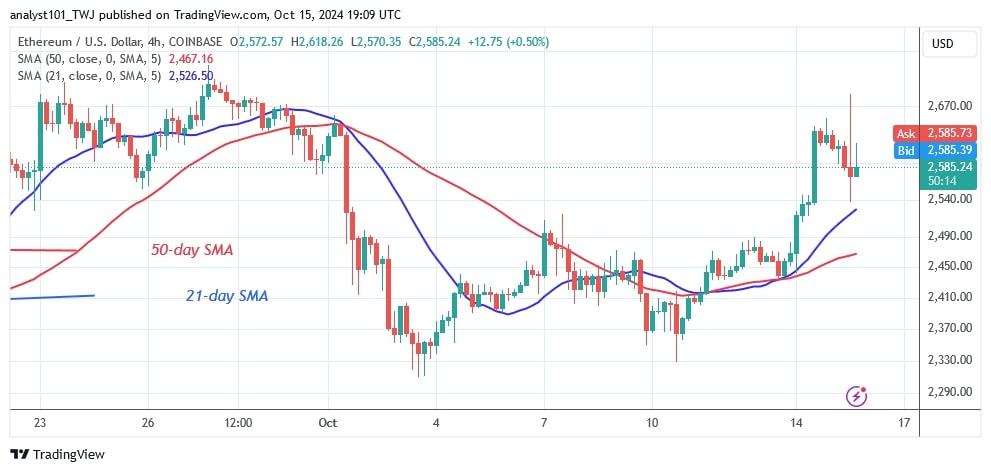
On the 4-hour chart, Ether is trading sideways below the $2,700 level. Since September 23, the sideways trend has been moving between the support at $2,300 and the resistance at $2,700. Ether's uptrend was halted by the resistance at $2,700. On October 15, the extended candlestick wick indicates significant upward pressure on the price level.

Disclaimer. This analysis and forecast are the personal opinions of the author. They are not a recommendation to buy or sell cryptocurrency and should not be viewed as an endorsement by CoinIdol.com. Readers should do their research before investing in funds.
 coinidol.com
