
Escalating tensions in the Middle East triggered a sharp downturn in the crypto market on Tuesday. This volatility led to the liquidation of over $500 million in positions. Leading altcoin Ethereum (ETH) was particularly affected, with long traders suffering significant losses.
Technical indicators suggest that this downturn has encouraged bears to make a move for market control — and they might be succeeding. Is October off to a rocky start?
Ethereum Long Traders Count Their Losses
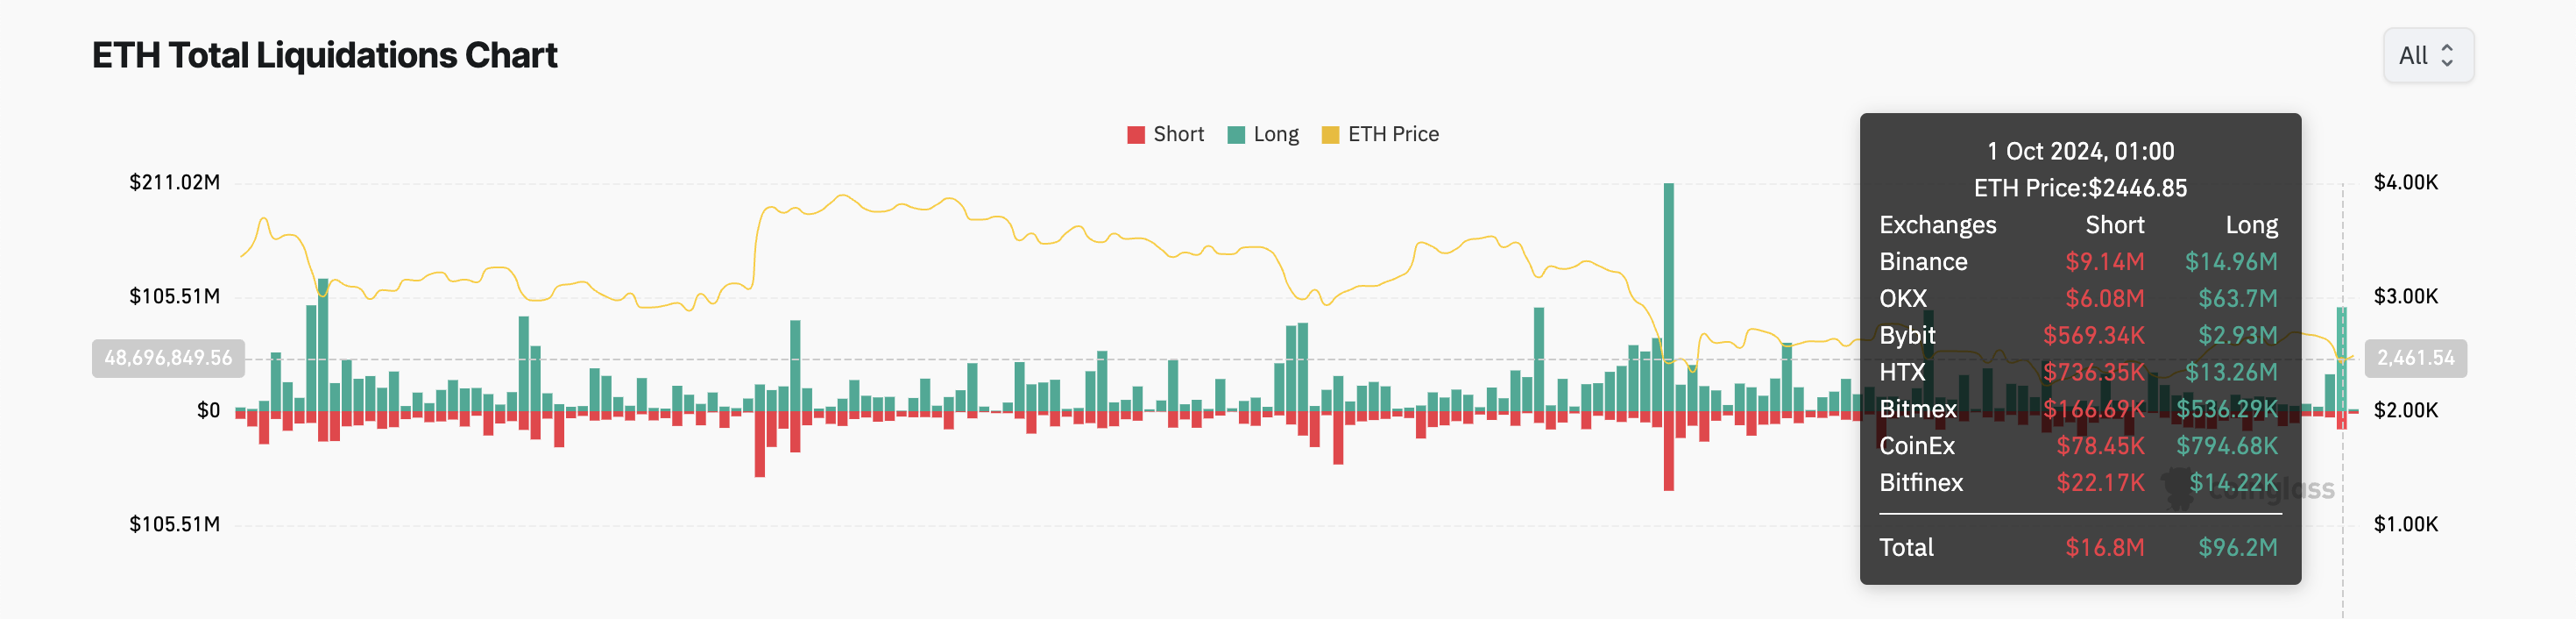
On Monday, Ethereum’s price fell to $2,447, a low last recorded ten days ago. This unexpected decline led to the liquidation of many long trades that had been opened in favor of a continued price rally.
When an asset’s value moves against a trader’s position, the exchange forcefully closes the position due to insufficient funds to maintain it, resulting in a liquidation. Long liquidations happen when traders with long positions must sell the asset at a lower price to cover their losses as the price declines.
This typically happens when the asset’s price falls below a specific level, compelling traders betting on a price rally to exit the market. According to Coinglass data, ETH long traders experienced $96 million in liquidations on Monday, marking the highest single-day liquidation in 57 days.
Read more: How to Invest in Ethereum ETFs?
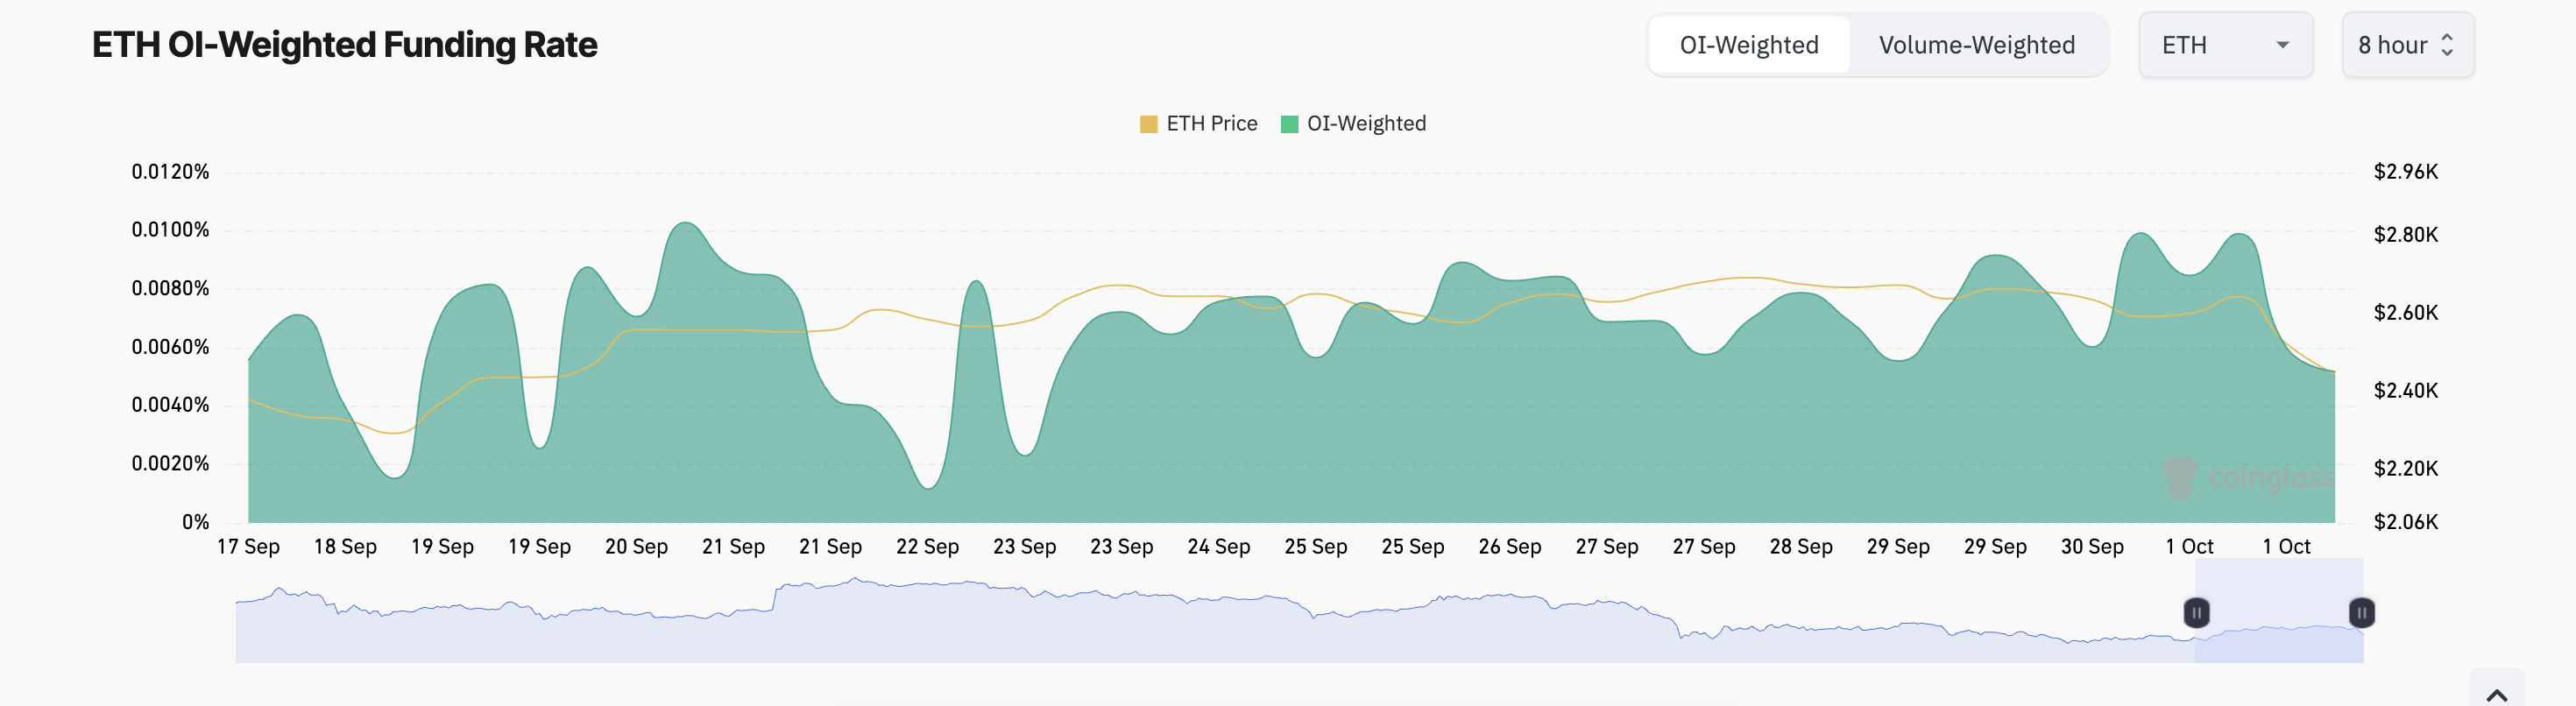
Despite recent losses, ETH futures traders continue to open more long positions. The coin’s funding rate — the periodic fee paid to keep its contract price aligned with its spot price — remains positive, signaling stronger demand for long positions over shorts.
Currently, the funding rate stands at 0.0052%, reflecting ongoing optimism among ETH futures traders.
ETH Price Prediction: Spot Traders Are Fearful
Ethereum’s technical setup suggests that its spot traders have adopted a different approach, as readings from the coin’s daily chart signal that the bears have regained market control.
For example, its Elder-Ray Index, which measures the relationship between the strength of buyers and sellers, has turned negative for the first time since September 11. When this indicator is negative, bear power is dominant in the market.
Furthermore, according to ETH’s moving average convergence/divergence (MACD) indicator, its MACD line (blue) has crossed below its signal line (orange) and is poised to fall further. This setup indicates a bearish outlook, signaling that momentum is shifting downward and a further price decline is likely.
Read more: Ethereum (ETH) Price Prediction 2024/2025/2030
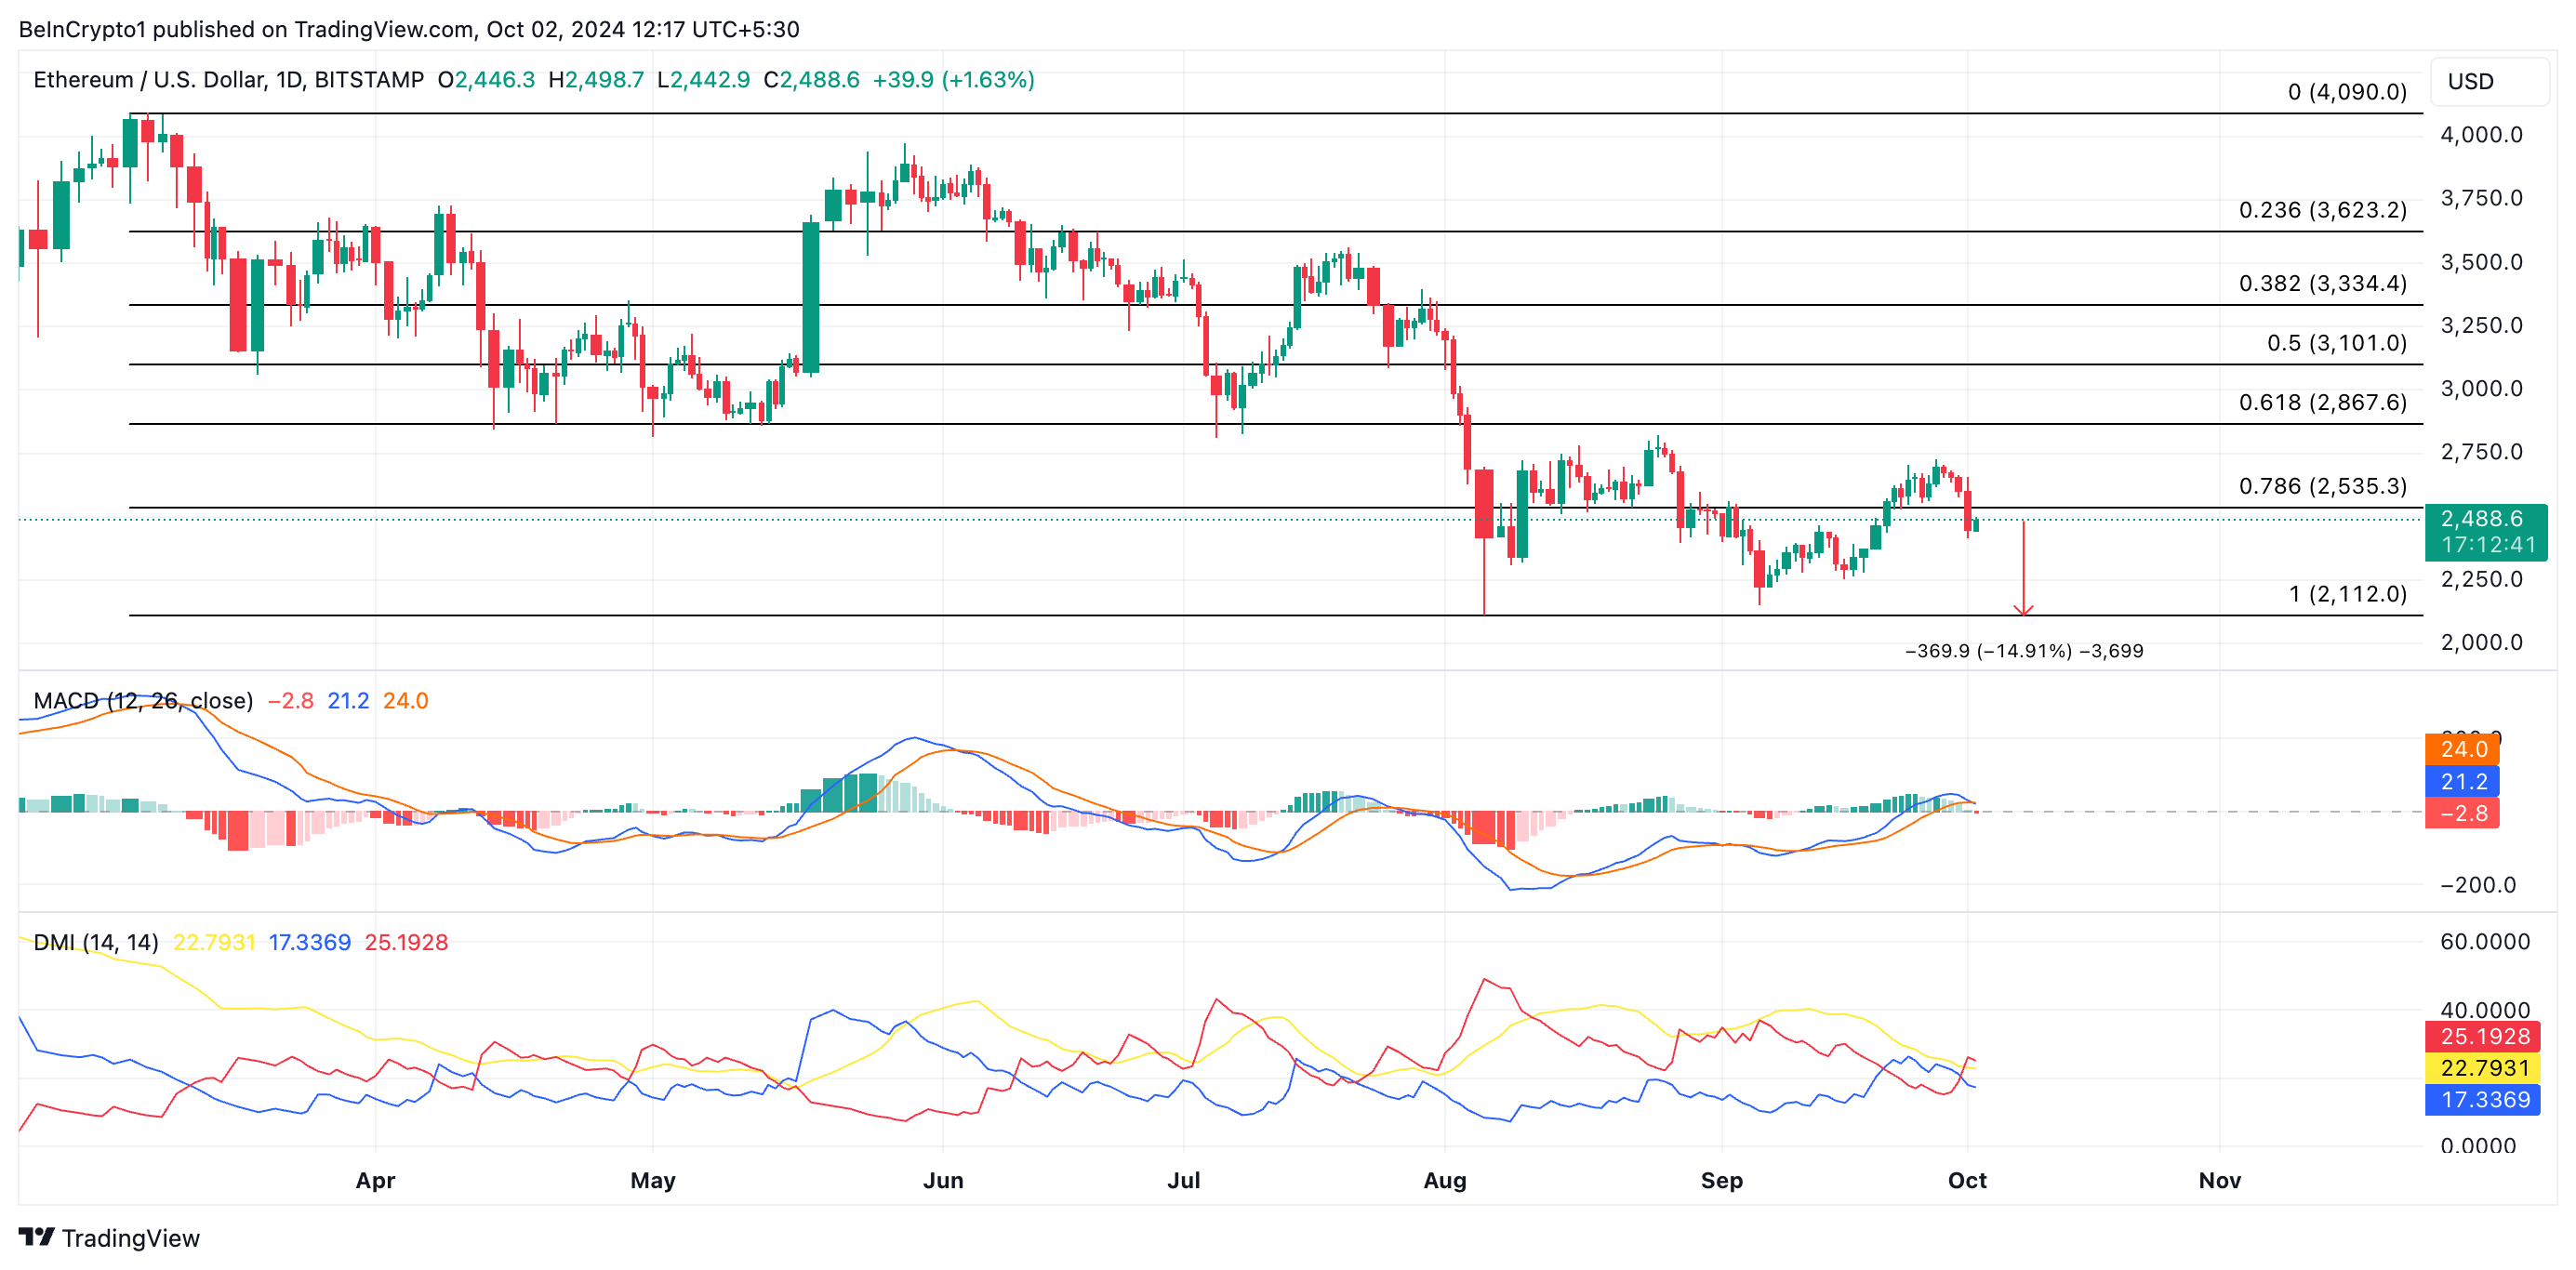
If selling pressure gains momentum, Ethereum’s price could retest its August 5 low of $2,112. This represents a 15% drop from its current level.
However, if the broader market trend improves, bulls may regain control and push Ethereum’s price toward the resistance level at $3,101.