
On Sept. 30, 2024, ethereum’s price showed consolidation near $2,630 after testing key support and resistance levels. The market exhibits mixed momentum, as oscillators point to neutrality while moving averages provide conflicting signals. Traders are closely watching whether the second leading crypto asset will break through resistance or test lower support zones, given the current indecision.
Ethereum
Ethereum’s 1-hour chart highlights recent price fluctuations, with the asset attempting to hold steady at around $2,630. After a drop to $2,591, buying volume spiked, reinforcing this level as significant short-term support. Despite the rebound, the current price action is marked by lower volume, signaling market hesitation.
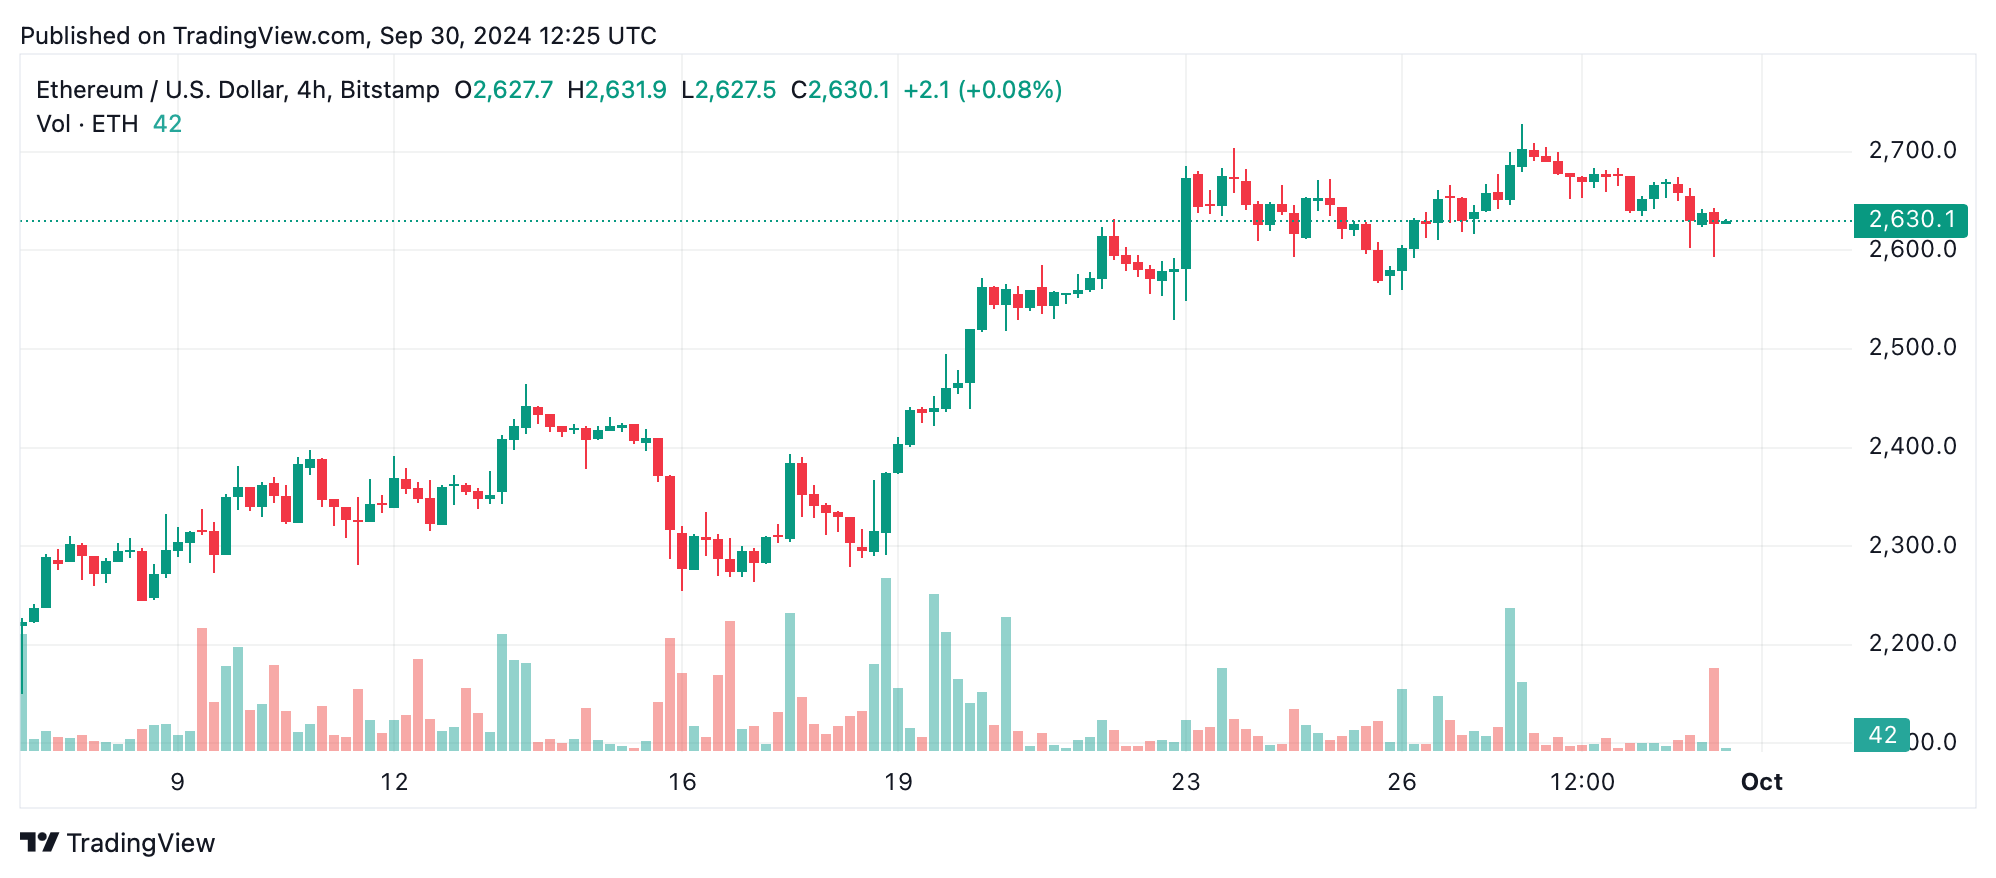
The 4-hour chart reflects a slight downtrend, following ethereum’s recent high of $2,729. The price has since declined to the $2,620 region but shows no clear sign of breaking below key support levels. A consistent pattern of lower highs and lows points to potential selling pressure, with traders monitoring the $2,640 level closely. If ether holds this support and volume increases, a bounce toward $2,700 is possible, but failure could see the price retreat toward $2,600 or lower.
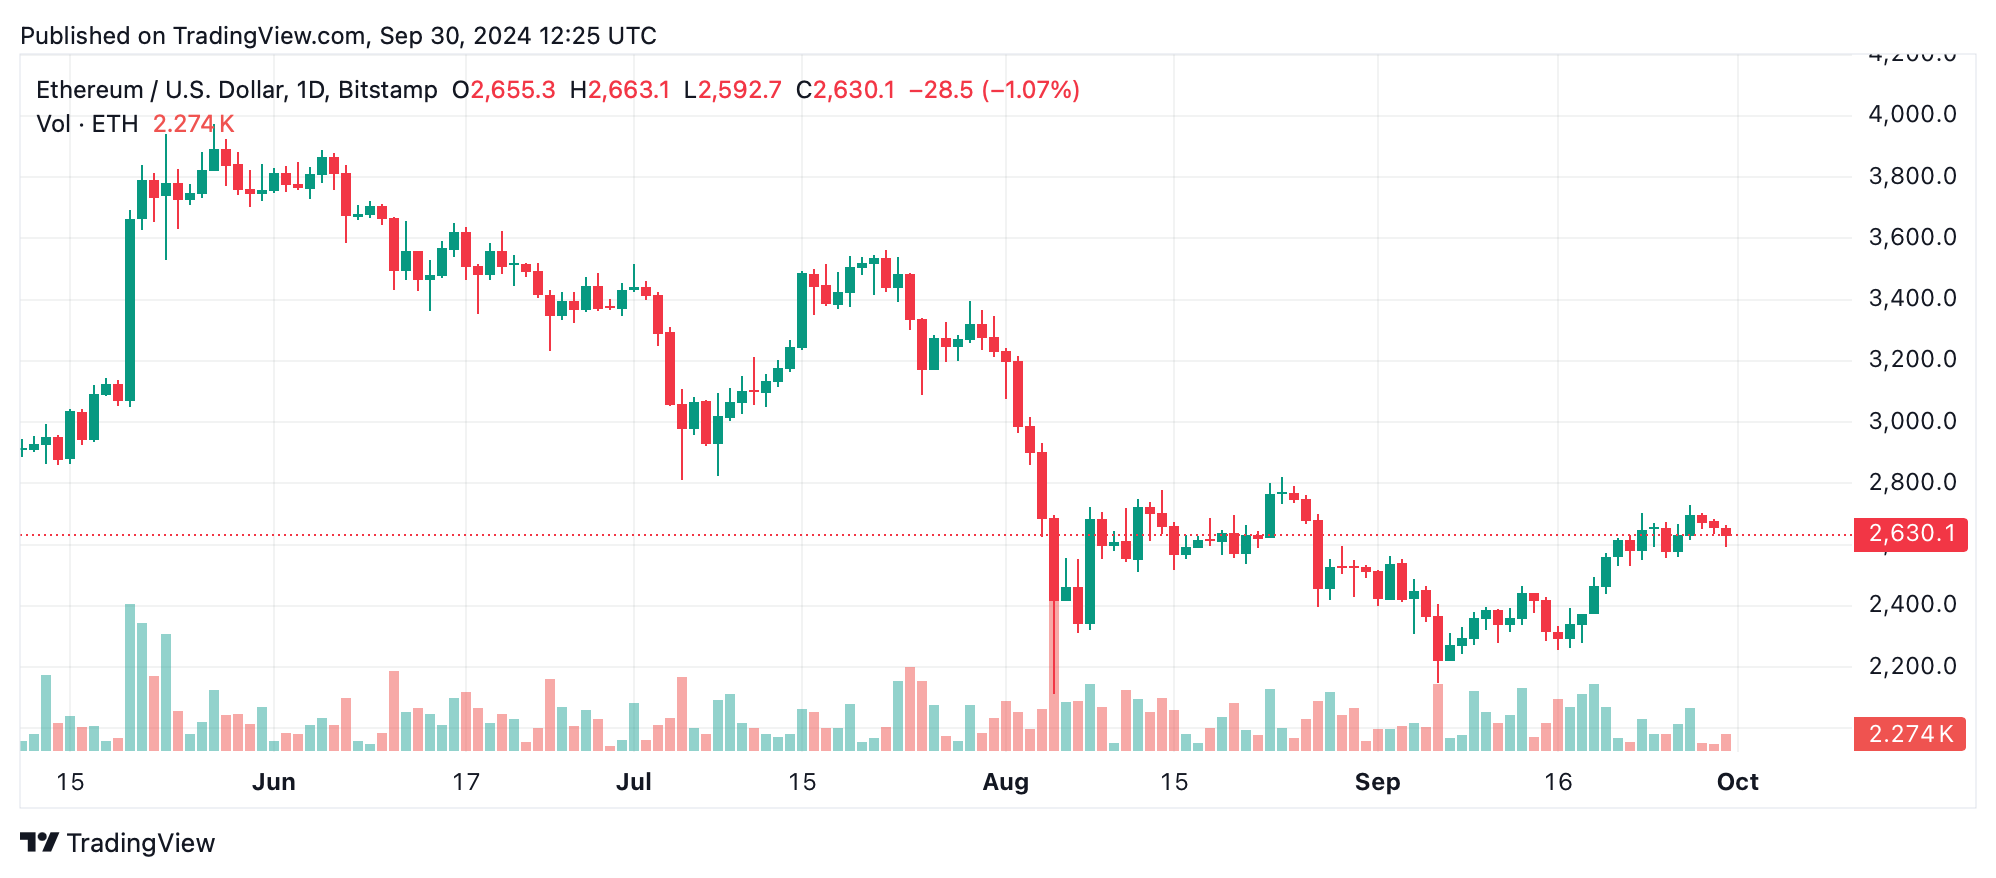
On the daily chart, ETH remains in an upward trend, moving from $2,149 to $2,729 over the past weeks. The market’s recent rejection near $2,729, coupled with bearish downturns on higher volume, suggests potential profit-taking. The price is currently testing support in the $2,650-$2,600 range. A sustained move below $2,600 could indicate the start of a deeper correction, but a rebound from this zone would confirm it as a solid entry point for long-term ETH traders.
Moving averages (MAs) provide conflicting signals. Short-term exponential moving averages (EMAs – 10, 20, 30, 50) are in a bullish posture, suggesting upward momentum remains intact. However, the longer-term moving averages, including the 100 and 200-period EMAs, signal bearish trends. The 200-day simple moving average (SMA), at $3,119, remains well above the current price, indicating the possibility of continued downward pressure unless ether can break through key resistance levels.
Oscillators are largely neutral, reflecting the market’s indecisiveness. The relative strength index (RSI) sits at 56, indicating neither overbought nor oversold conditions. Momentum indicators, like the awesome oscillator and the moving average convergence divergence (MACD), are mixed, with the latter flashing a buy signal while momentum shows a sell signal. This suggests that ethereum could consolidate further before making a decisive move, leaving traders waiting for clearer directional cues.
Bull Verdict:
Ethereum’s ability to hold above the $2,600 support zone, coupled with bullish short-term moving averages and a recent rebound from $2,591, suggests that upward momentum may resume. If buying pressure increases and ether breaks through the $2,700 resistance, a rally toward the recent high of $2,729 and beyond could unfold, making it a favorable environment for long positions.
Bear Verdict:
The bearish signals from longer-term moving averages and the rejection near $2,729 indicate caution. If ethereum fails to maintain support around $2,600, and momentum weakens further, a breakdown could lead to a deeper correction toward $2,500 or below. The current indecisiveness, combined with mixed oscillator readings, suggests traders should remain cautious of further downside risks