
Ethereum's ($ETH) price has been on a downward trend lately, catching the attention of investors and traders. As the market watches closely, many are wondering what's next for one of the top cryptocurrencies. Is this just a short-term dip, or could it signal something more? In this Ethereum Price Prediction article, we'll explore the current price movement of Ethereum
How has the Ethereum Price Moved Recently?
As of today, Ethereum ($ETH) is valued at $2,616.36, with a 24-hour trading volume of $45.90 billion, a market cap of $314.93 billion, and a market dominance of 13.94%. In the past 24 hours, its price has dropped by 1.27%.
Ethereum hit its peak on November 10, 2021, when it reached an all-time high of $4,867.17. In contrast, its lowest point was on October 21, 2015, at $0.420897. Since reaching its all-time high, the lowest price recorded was $897.01 (cycle low), while the highest price since that low was $4,094.18 (cycle high). The current price prediction sentiment for Ethereum is bearish, with the Fear & Greed Index indicating a value of 61, suggesting a state of "Greed."
The circulating supply of Ethereum stands at 120.37 million $ETH. Over the past year, the supply has grown by 0.11%, with 130,818 $ETH newly created.
Why Is Ethereum Price Plunging?
Ethereum's price is currently experiencing a dip as a result of external pressures, particularly those stemming from developments in the Japanese market. These pressures have caused a ripple effect across major cryptocurrencies, including Bitcoin, which struggled to maintain its position above $65,000.
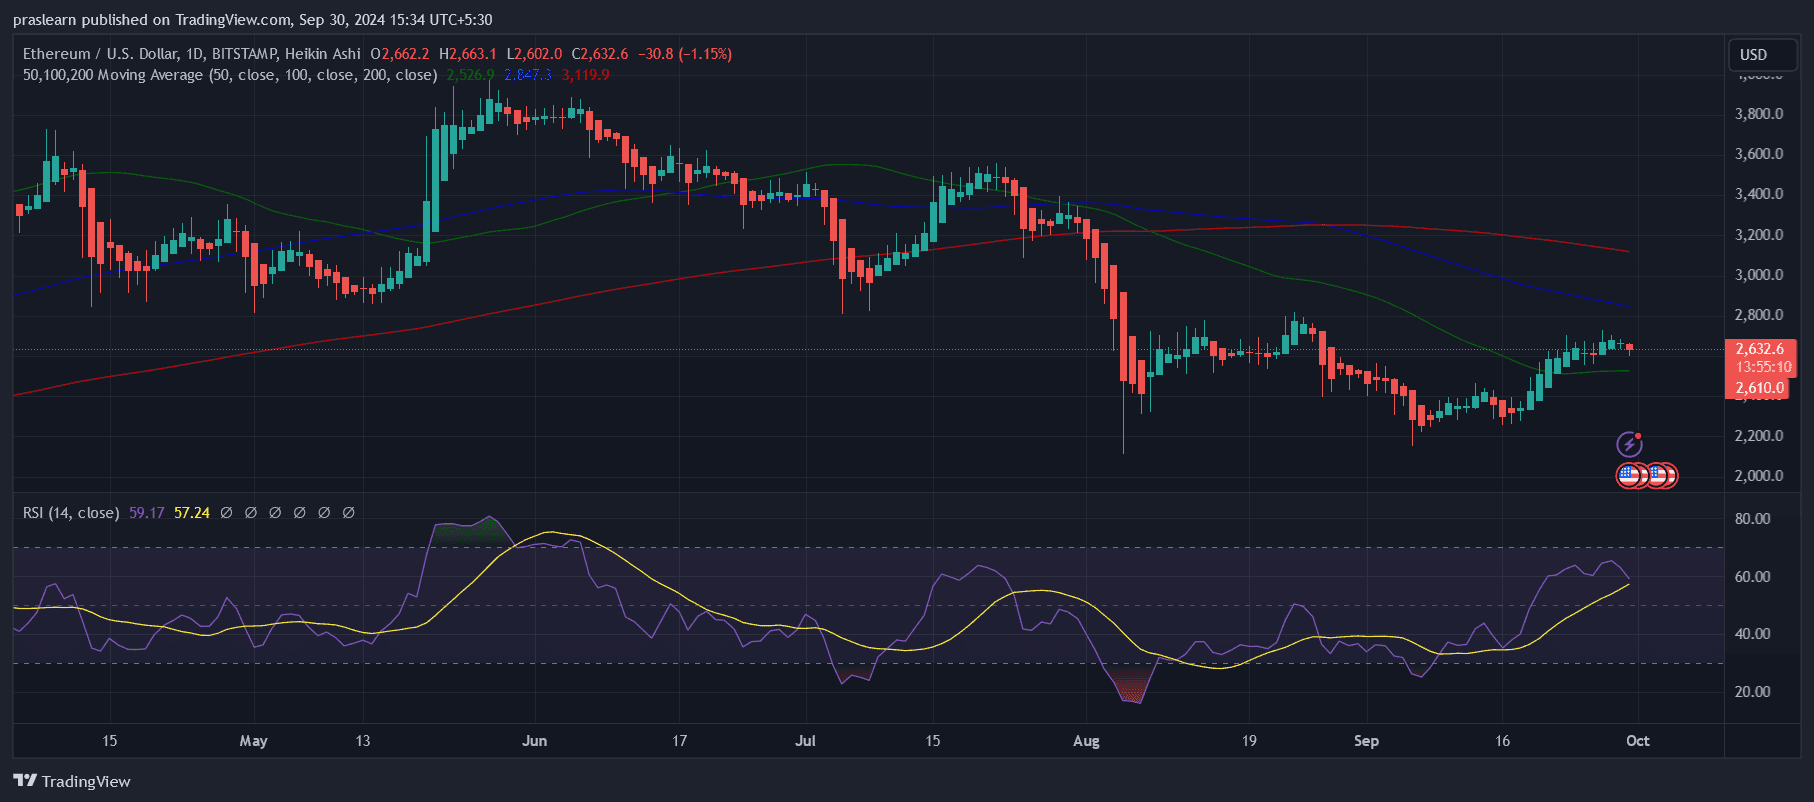
For Ethereum, the price hovers around its 50-day Exponential Moving Average (EMA) of $2,594, a critical support level. After breaking through its descending trendline on September 19, Ethereum saw an 11% rally, but this upward momentum faces challenges.
If the 50-day EMA holds as a support, Ethereum may have the potential to rebound and retest its previous high of $2,820 from August 24. The success of this upward movement, however, is closely tied to the market's sentiment and trading indicators.
The Relative Strength Index (RSI), currently around 57 on the daily chart, shows a decrease in bullish momentum. To sustain any rally, the RSI would need to rise above 60, signaling renewed strength among buyers. Should the RSI not recover, the current support level could fail, leading to a further decline in Ethereum's price.
Predictively, the direction of Ethereum's price will depend on two key factors: the resilience of its 50-day EMA as a support line and an improvement in its RSI. If buyers can maintain this crucial support level and the RSI trends upwards, we may see Ethereum testing the $2,820 resistance and potentially pushing even higher.
However, if the selling pressure from market developments continues and the RSI remains subdued, Ethereum could see more downward movement in the short term. This uncertainty underscores the importance of monitoring both market trends and technical indicators closely.
How high can Ethereum Price go?
Ethereum has demonstrated impressive growth over the past year, with its price increasing by 58%, indicating substantial interest and activity from investors. The cryptocurrency also exhibited a strong performance over the last month, with 17 green days out of 30 (57%), suggesting short-term momentum.
However, despite these positive signs, Ethereum's overall performance is somewhat mixed. It has underperformed compared to 51% of the top 100 crypto assets over the same period and has lagged behind Bitcoin, which typically sets the tone for the broader crypto market.
Moreover, Ethereum is currently trading below its 200-day Simple Moving Average (SMA), a key indicator often used to determine the overall trend. Trading below this long-term average suggests a bearish sentiment in the broader context, which could limit the upside potential in the short term.
The high liquidity of Ethereum, driven by its market cap and trading volume, provides a foundation for significant price movements, both upward and downward. Additionally, Ethereum's low yearly inflation rate of 0.11% makes it an attractive asset for investors seeking long-term value retention, as the limited increase in supply helps maintain its price level.
If Ethereum can maintain its support around the 50-day EMA and regain bullish momentum reflected by an RSI above 60, there is potential for Ethereum to test its August high of $2,820. Breaking above this level could set the stage for further gains, particularly if the broader market sentiment turns more bullish.
In the long term, Ethereum’s ability to push higher will depend on a combination of technical factors and market conditions. If Ethereum can break above its 200-day SMA, this would signal a potential reversal into a long-term bullish trend. In this scenario, Ethereum could aim to revisit its previous all-time high of around $4,867.17, provided that broader market conditions, such as Bitcoin's performance and global economic developments, are favorable.
Conversely, without a shift above the 200-day SMA or a significant increase in bullish momentum, Ethereum's price may struggle to achieve substantial gains beyond its recent highs, leading to more consolidated or sideways movement.
Overall, Ethereum has strong upward potential, but how high it can go will largely depend on its ability to overcome current resistance levels and regain positive momentum in line with the overall crypto market.
A sustained rally would require not only technical indicators to align in its favor but also a supportive macroeconomic backdrop and positive developments in the crypto sector as a whole.