
Despite its ongoing struggles on the market, Ethereum has reached a critical price point. When compared to Bitcoin, $ETH has started to lose traction after dropping below the crucial 0.4 BTC ratio for the first time in more than three years. Ethereum now faces the possibility of a further decline, and the chart does not currently show any strong support levels, making the situation appear more and more dire.
The current state of the Ethereum market is anything but bullish. It is not enough to ensure a rally or bull run in the near future even though there is a chance for a higher low to form, which might indicate some support. Investors are wary because of the asset's unstable price structure and its current $2,300 range. In light of this recent breakdown, there are three crucial price levels to keep a close eye on.
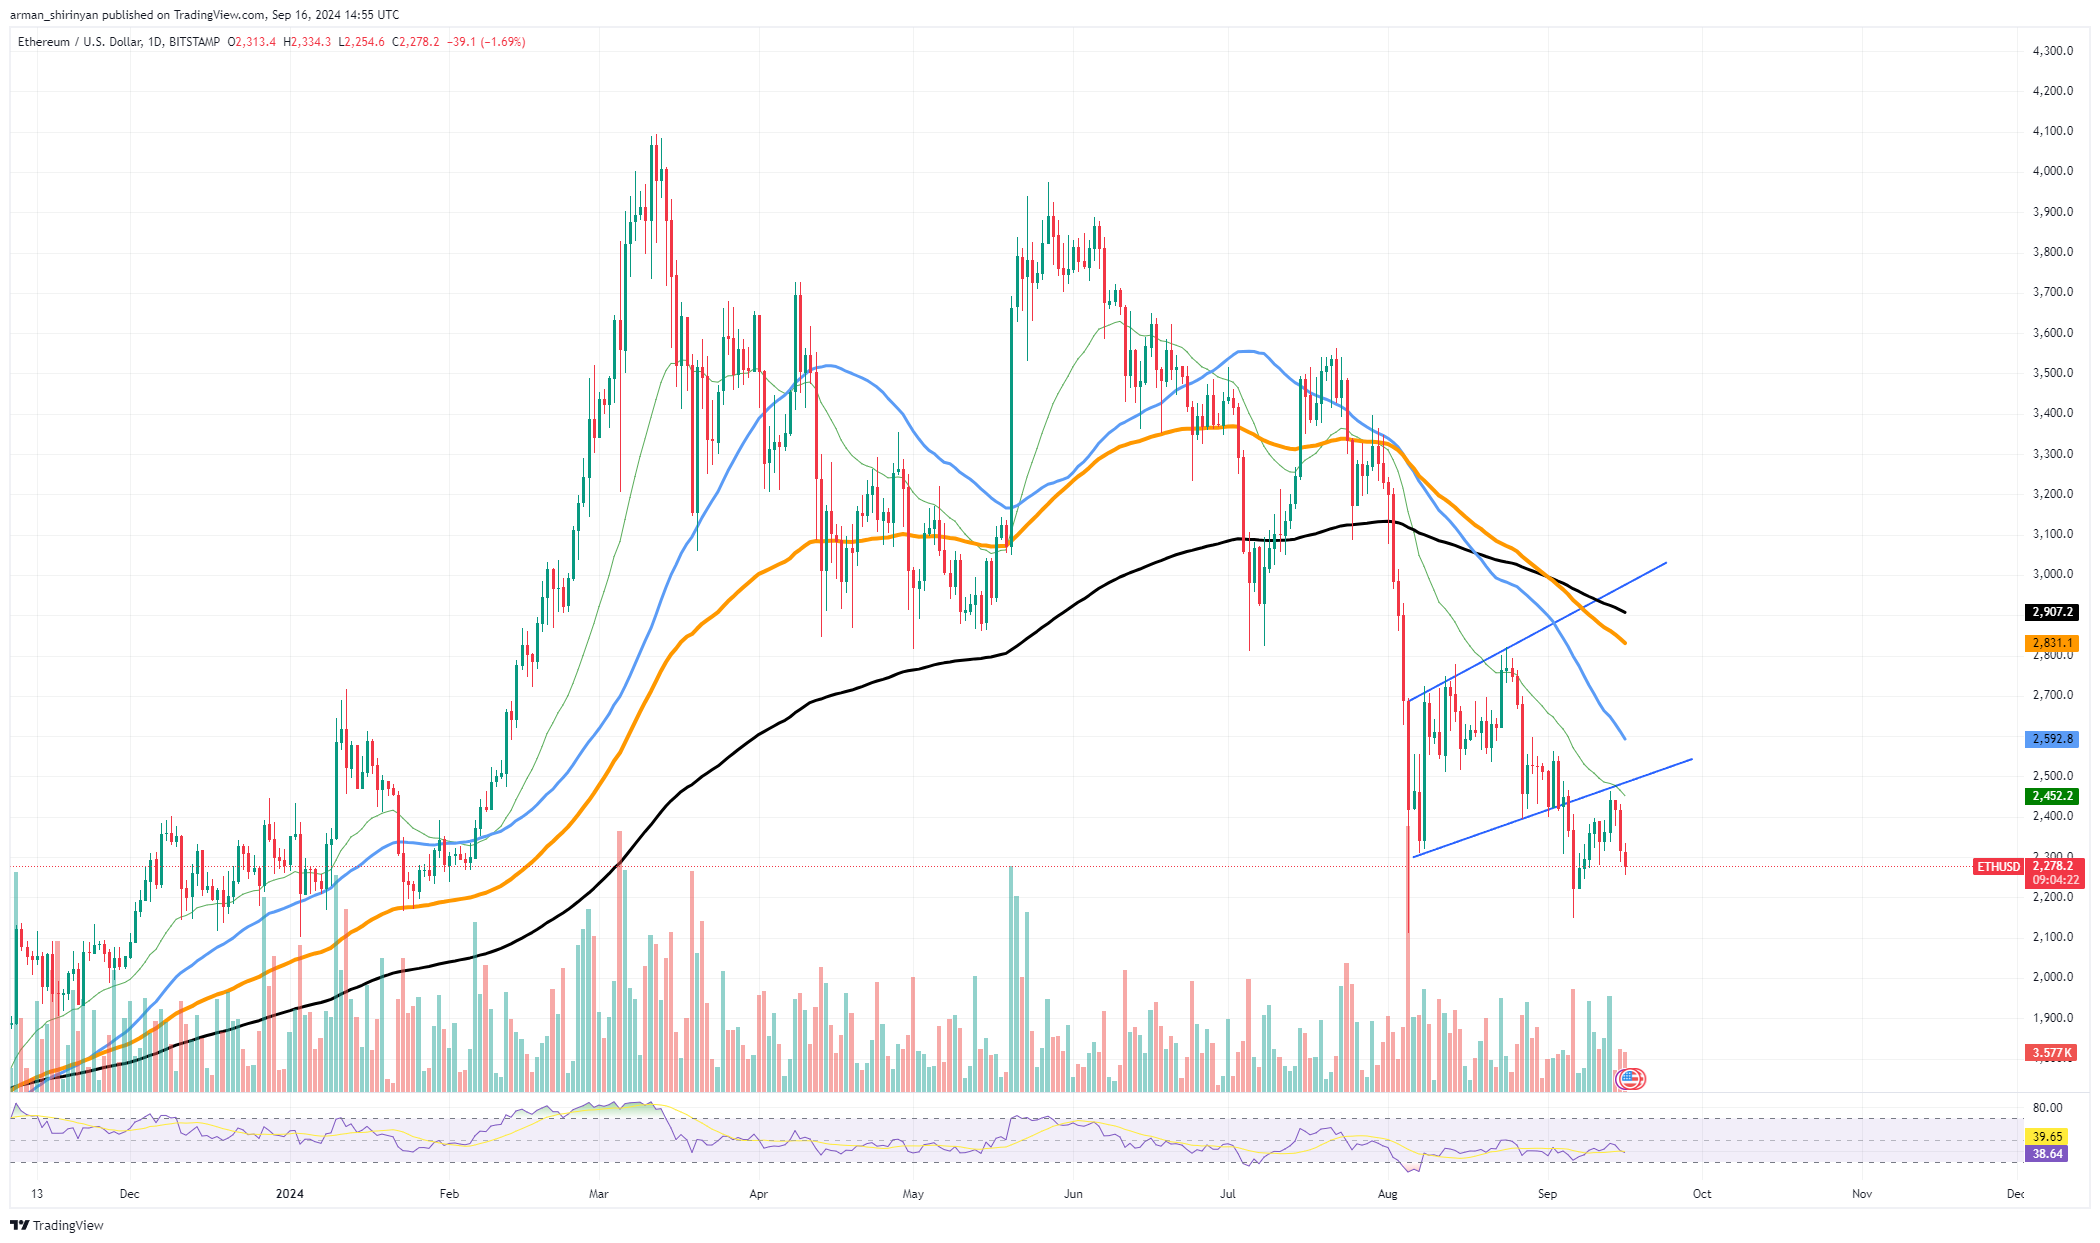
The $2,100 level is the lower limit that could provide short-term support right now. Ethereum may face stronger selling pressure if it is unable to maintain this level.
$1,800 level: If the drop persists, Ethereum has previously recovered from this critical support area, which represents the next important level. The downward trajectory could quicken considerably if this level is lost.
$1,500 level: If all prior levels are ineffective, Ethereum may retest this level, which has not been reached since early 2021. For $ETH, this would be a worrying development, as it would imply a more profound market correction.
All things considered, Ethereum's current standing is still unstable due to the lack of solid support and the potential for more bearish pressure. Investors will have to keep an eye on these critical levels and look out for any indications of a possible reversal.
$XRP's weak offensive
Once again proving to be a crucial resistance, $XRP encountered a strong rejection at the $0.59 price level. According to this rejection, the descending part of the symmetrical triangle is still in place, and the $XRP bulls were not able to break through into the $0.60 zone.
It is possible that $XRP is about to retrace after failing to break above the upper trendline. In recent months, the symmetrical triangle has been a key pattern for $XRP, with bulls and bears vying for dominance. The possibility that $XRP will test the triangle's lower boundary has grown in light of the most recent rejection. The $0.55 level may see a reversal, providing $XRP with support.
The $0.52 region would be the next important zone to monitor if the price breaks. Two scenarios for the continuation are possible from here:
Bearish scenario: A repeat breakdown of $XRP is possible if it is unable to hold the support at $0.55 or $0.52. In order to test the psychological $0.50 level, the price could drop, which might draw more sellers.
There may be a bounce if $XRP finds support at the symmetrical triangle's lower border. With an eye toward another push to the $0.59 resistance, bulls will probably try to retake the lead. There may be a rally toward $0.65 indicating a bullish continuation if $XRP breaks above $0.59 and closes above the descending trendline.
Solana hits wall
Solana has reached a brick wall in its quest to retake the $150 price threshold. The recent upward movement's sustainability is being questioned due to its inability to surpass the 200-day exponential moving average.
An important long-term trend indicator, the 200 EMA, has served as a major resistance level, and Solana's failure to break through it points to a possible slowdown in momentum. The fact that SOL is currently trading at $131 suggests that bulls were unable to muster the strength necessary to move the price past the crucial resistance zone between $145 and $150. The recent bullish phase of Solana may come to an end if there is not a major catalyst that sparks a rally again.
There are a few levels to watch, including the $125 price threshold. If the market declines even more, this level will be crucial for Solana's support. A breakdown below $125 can be a sign that selling pressure is building and could trigger more declines.
The $115 mark would be the next important area to monitor if the $125 support fails. An even deeper retreat could be confirmed by a breach below this level.
Resistance levels are $145-$150; this is still Solana's most important area of resistance. The $160-$170 region can be reached if the rally continues - if there is a breakout above this zone.
$139 (100 EMA): The market may regain bullish momentum if Solana is able to break above the 100 EMA at $139, but the rally is still vulnerable if it does not reach $150.