
- Ethereum ETFs saw $5 million in net inflows as Grayscale Ethereum Trust ended its outflow streak.
- Investors are accumulating Ethereum, as evidenced by increased outflows and declining reserves across $ETH exchanges.
- Key technical indicators suggest Ethereum could decline 25% to approach the $2,000 psychological level.
Ethereum is up more than 2% on Tuesday following minor inflows across $ETH ETFs. $ETH technical indicators suggest that its price could approach the $2,000 psychological level in the coming weeks, but investors' accumulation may prevail due to key on-chain metrics.
Daily digest market movers: $ETH ETF flows, investor accumulation
Ethereum ETFs recorded minor net inflows of $5 million on Monday, according to data from Farside Investors. The net inflows came after three consecutive days of net outflows across the nine US spot $ETH ETFs.
Grayscale Ethereum Trust (ETHE) had zero flows, the first time it hasn't seen outflows since $ETH ETFs launched. Fidelity's FETH led the way with $4 million in net inflows, accompanied by Bitwise's ETHW, which saw $2.9 million in inflows. Notably, VanEck's ETHV saw net outflows for the first time, recording a loss of $2.9 million.
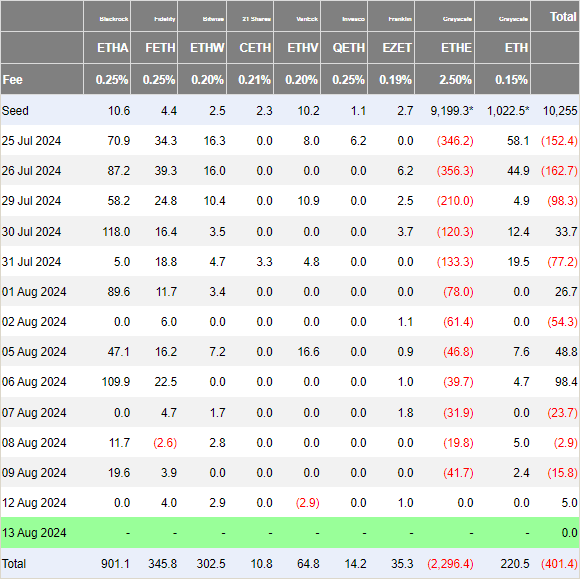
Ethereum ETF Flows
Meanwhile, CryptoQuant's data shows that Ethereum has seen a net exchange outflow of over 306,000 $ETH since the market decline on August 5.
$ETH's exchange reserves have also depleted to a one-month low of 16.8 million $ETH, as it has been in a downtrend since August 2. A decrease in exchange reserves suggests higher buying pressure.
$ETH Exchange Reserve - All Exchanges" src="https://cnews24.ru/uploads/abc/abc656e7a58f55e91b52aa0246a2931a5ec16dc5.png" size="4000x2250">
$ETH Exchange Reserve - All Exchanges
The increased $ETH net exchange outflows and declining exchange reserves suggest investors are accumulating $ETH in anticipation of a potential price rally.
$ETH technical analysis: Ethereum could approach the $2,000 psychological level
Ethereum is trading around $2,710 on Tuesday, up 2% on the day. In the past 24 hours, it has seen over $27 million in liquidations, with long and short liquidations accounting for $16.29 million and $11.28 million, respectively.
Ethereum's price mimics the cautious sentiment across the crypto market, with a bias toward the downside. This is evident in the $ETH Long/Short Ratio, which fell from 1.01 to 0.91, indicating that bears have slightly prevailed over bulls in the past 24 hours.
$ETH saw a rejection around $2,730, a few cents above the $2,723 key resistance level. The move follows a key trendline suggesting $ETH could fall by 25% to record a swing low around $2,020 before rebounding.
As previously discussed, $ETH posted similar moves from August 2022 to November 2022 and July 2023 to October 2023, after which it rallied. Hence, the $2,020 price level could be crucial to watch for seller exhaustion and a potential fresh rally in the coming weeks.
$ETH/$USDT Daily chart" src="https://cnews24.ru/uploads/830/8301fb2630a1c4b3edf45a0f2f843438c5bdb1b3.png" size="1281x571">
$ETH/$USDT Daily chart
The %K line of the Stochastic Oscillator (Stoch) was rejected at the 50 midpoint and is now at 48, tilting downwards slightly in an attempt to cross below the %D line. Such a move in the Stoch indicates cautiousness, with sentiment tilted toward a short-term bearish move.
The Fibonacci (Fib) retracement suggests $ETH could find support at the 23.6% level, which is currently around $2,453. The 23.6% level is one of the key Fib ratios, along with 38.2%, 50% and 61.8%. When an asset's price retraces a portion of its prior move, traders often watch these Fib levels to see if they will act as support or resistance. Hence, if $ETH moves below $2,453, it will give credence to the short-term bearish outlook.
An $ETH daily candlestick close above the 50% level of the Fib retracement around $2,836 will invalidate the bearish thesis.