
Ethereum’s price on July 22, 2024, stands at $3,497, showing a dynamic interplay of market forces. The cryptocurrency’s recent movements exhibit consolidation with a potential bullish resurgence.
Ethereum
The 1-hour ETH/USD chart reveals critical support at $3,411 and resistance at $3,565. Ethereum’s price has been oscillating within these boundaries, with noticeable volume spikes at pivotal movements, indicating strong market interest and potential reversal points. The recent trend displays a downward trajectory followed by recovery, suggesting a tactical entry around $3,480-$3,500, anticipating a rebound towards the resistance level of $3,565.
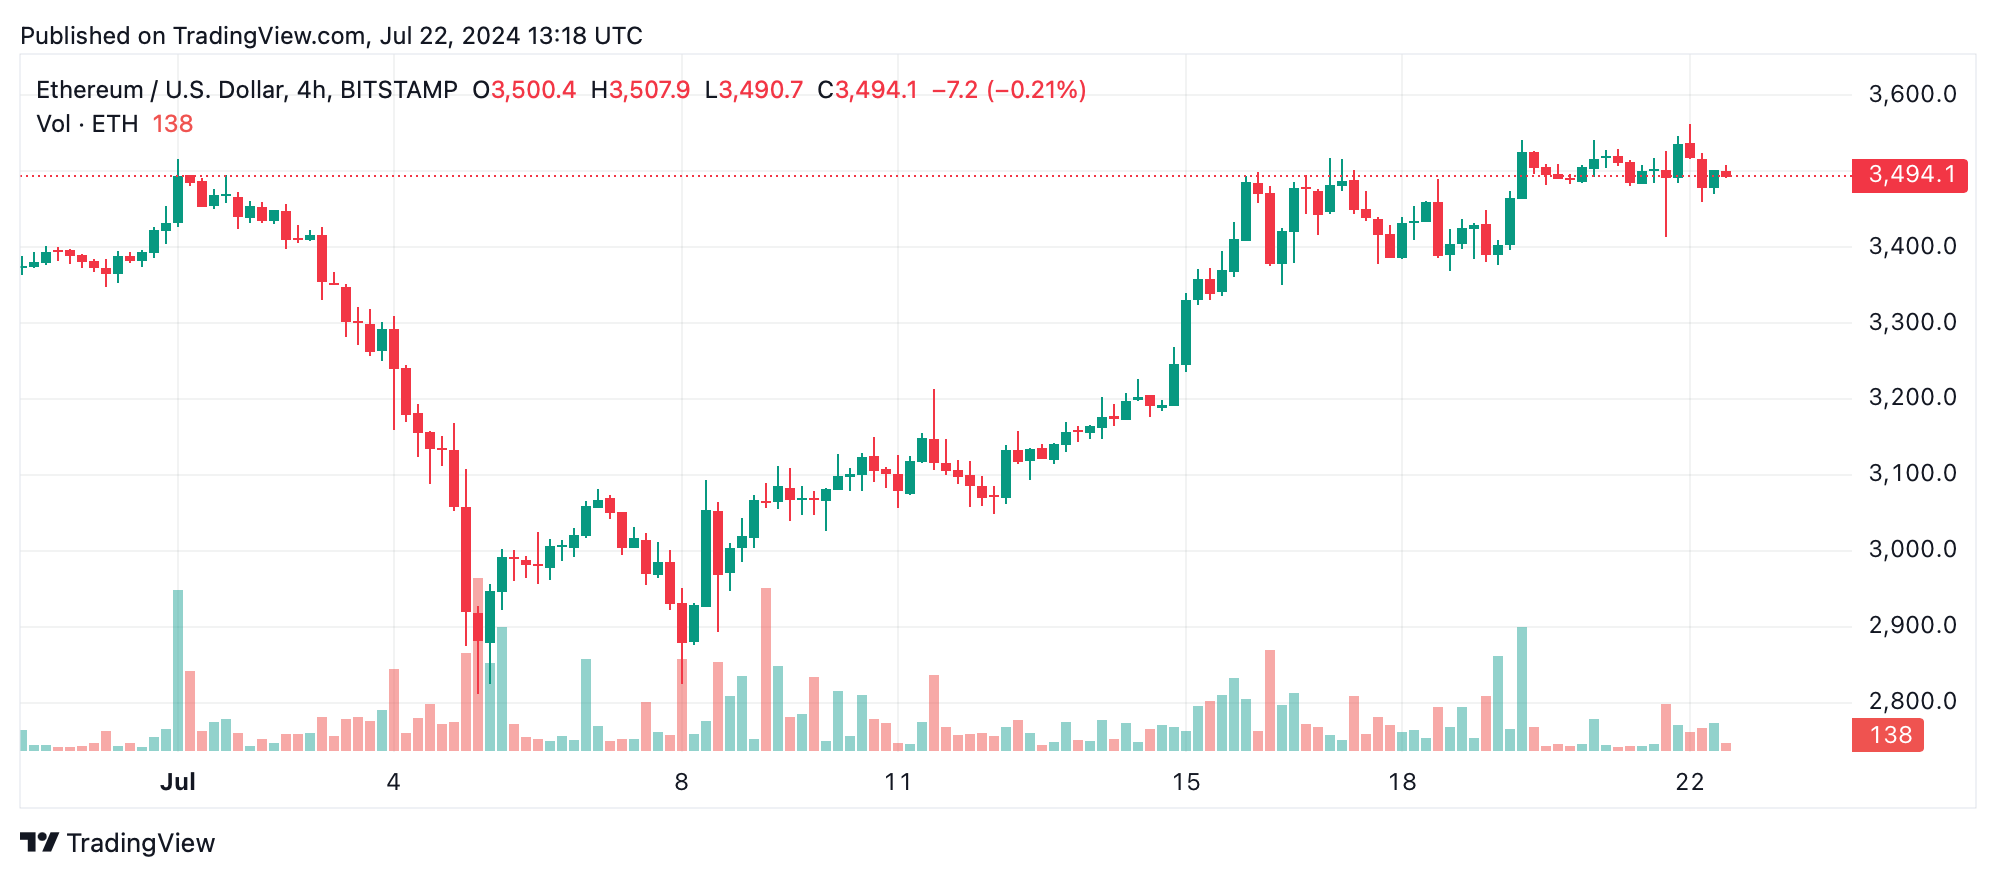
On the 4-hour chart, ethereum exhibits a broader support zone around $3,366 and resistance at $3,565. High volume during significant price movements, especially during recent declines and recoveries, marks these levels as crucial. The price’s sharp drop followed by a steady recovery hints at a consolidation phase.
The daily chart positions ethereum within a support range of $2,803 and a recent high of $3,628. Significant volume during major drops and subsequent recoveries underscores the importance of these levels. Following a substantial decline, Ethereum’s steady recovery suggests a bullish short-to-medium-term outlook.
Examining the oscillators provides a mixed sentiment. The relative strength index (RSI) at 58.8 signals neutrality, while the Stochastic at 94.6 suggests bearish signals. The commodity channel index (CCI) at 96.6 and the average directional index (ADX) at 22.7 remain neutral. Conversely, the momentum oscillator at 363.9 indicates bearishness, whereas the moving average convergence divergence (MACD) level at 43.2 advocates bullish sentiment. This mixed array of indicators reflects market uncertainty, emphasizing the need for cautious optimism.
The moving averages (MAs) exhibit a predominantly bullish sentiment. Short-term averages, such as the 10-day exponential moving average (EMA) and simple moving average (SMA), position at $3,421 and $3,422, respectively, signal positive actions. This bullish trend extends across mid-term averages (20-day to 50-day), with EMAs and SMAs consistently indicating buying opportunities. Long-term MAs (100-day and 200-day) also support a bullish outlook, with values significantly below current prices, reinforcing the overall positive market sentiment.
Bull Verdict:
Ethereum’s technical indicators suggest a bullish sentiment, with MAs predominantly signaling buy opportunities and a strong potential for price recovery and further gains.
Bear Verdict:
Despite the positive outlook from MAs, the mixed signals from oscillators and the current consolidation phase warrant caution, indicating potential for downward movement if critical support levels fail to hold.