Ethereum’s price is currently trying to penetrate a key level, and if successful, the recent correction could finally be over.
Technical Analysis
By TradingRage
The Daily Chart
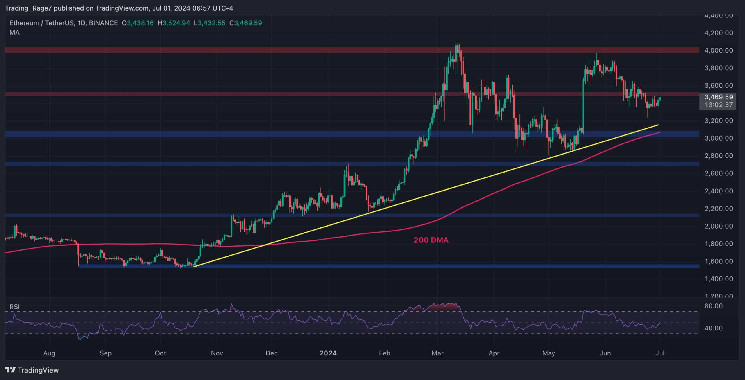
As the daily chart displays, the Ethereum price has been dropping since getting rejected from the $4,000 resistance level back in May.
The market has since dropped below the $3,500 level, but it is currently testing it from below. If the price is able to reclaim this level, the cryptocurrency could finally rally toward values higher than $4,000.
On the other hand, in case of a rejection, if the price also loses the long-term bullish trendline and the 200-day moving average located around the $3,000 level, things can get very ugly for ETH.
The 4-Hour Chart
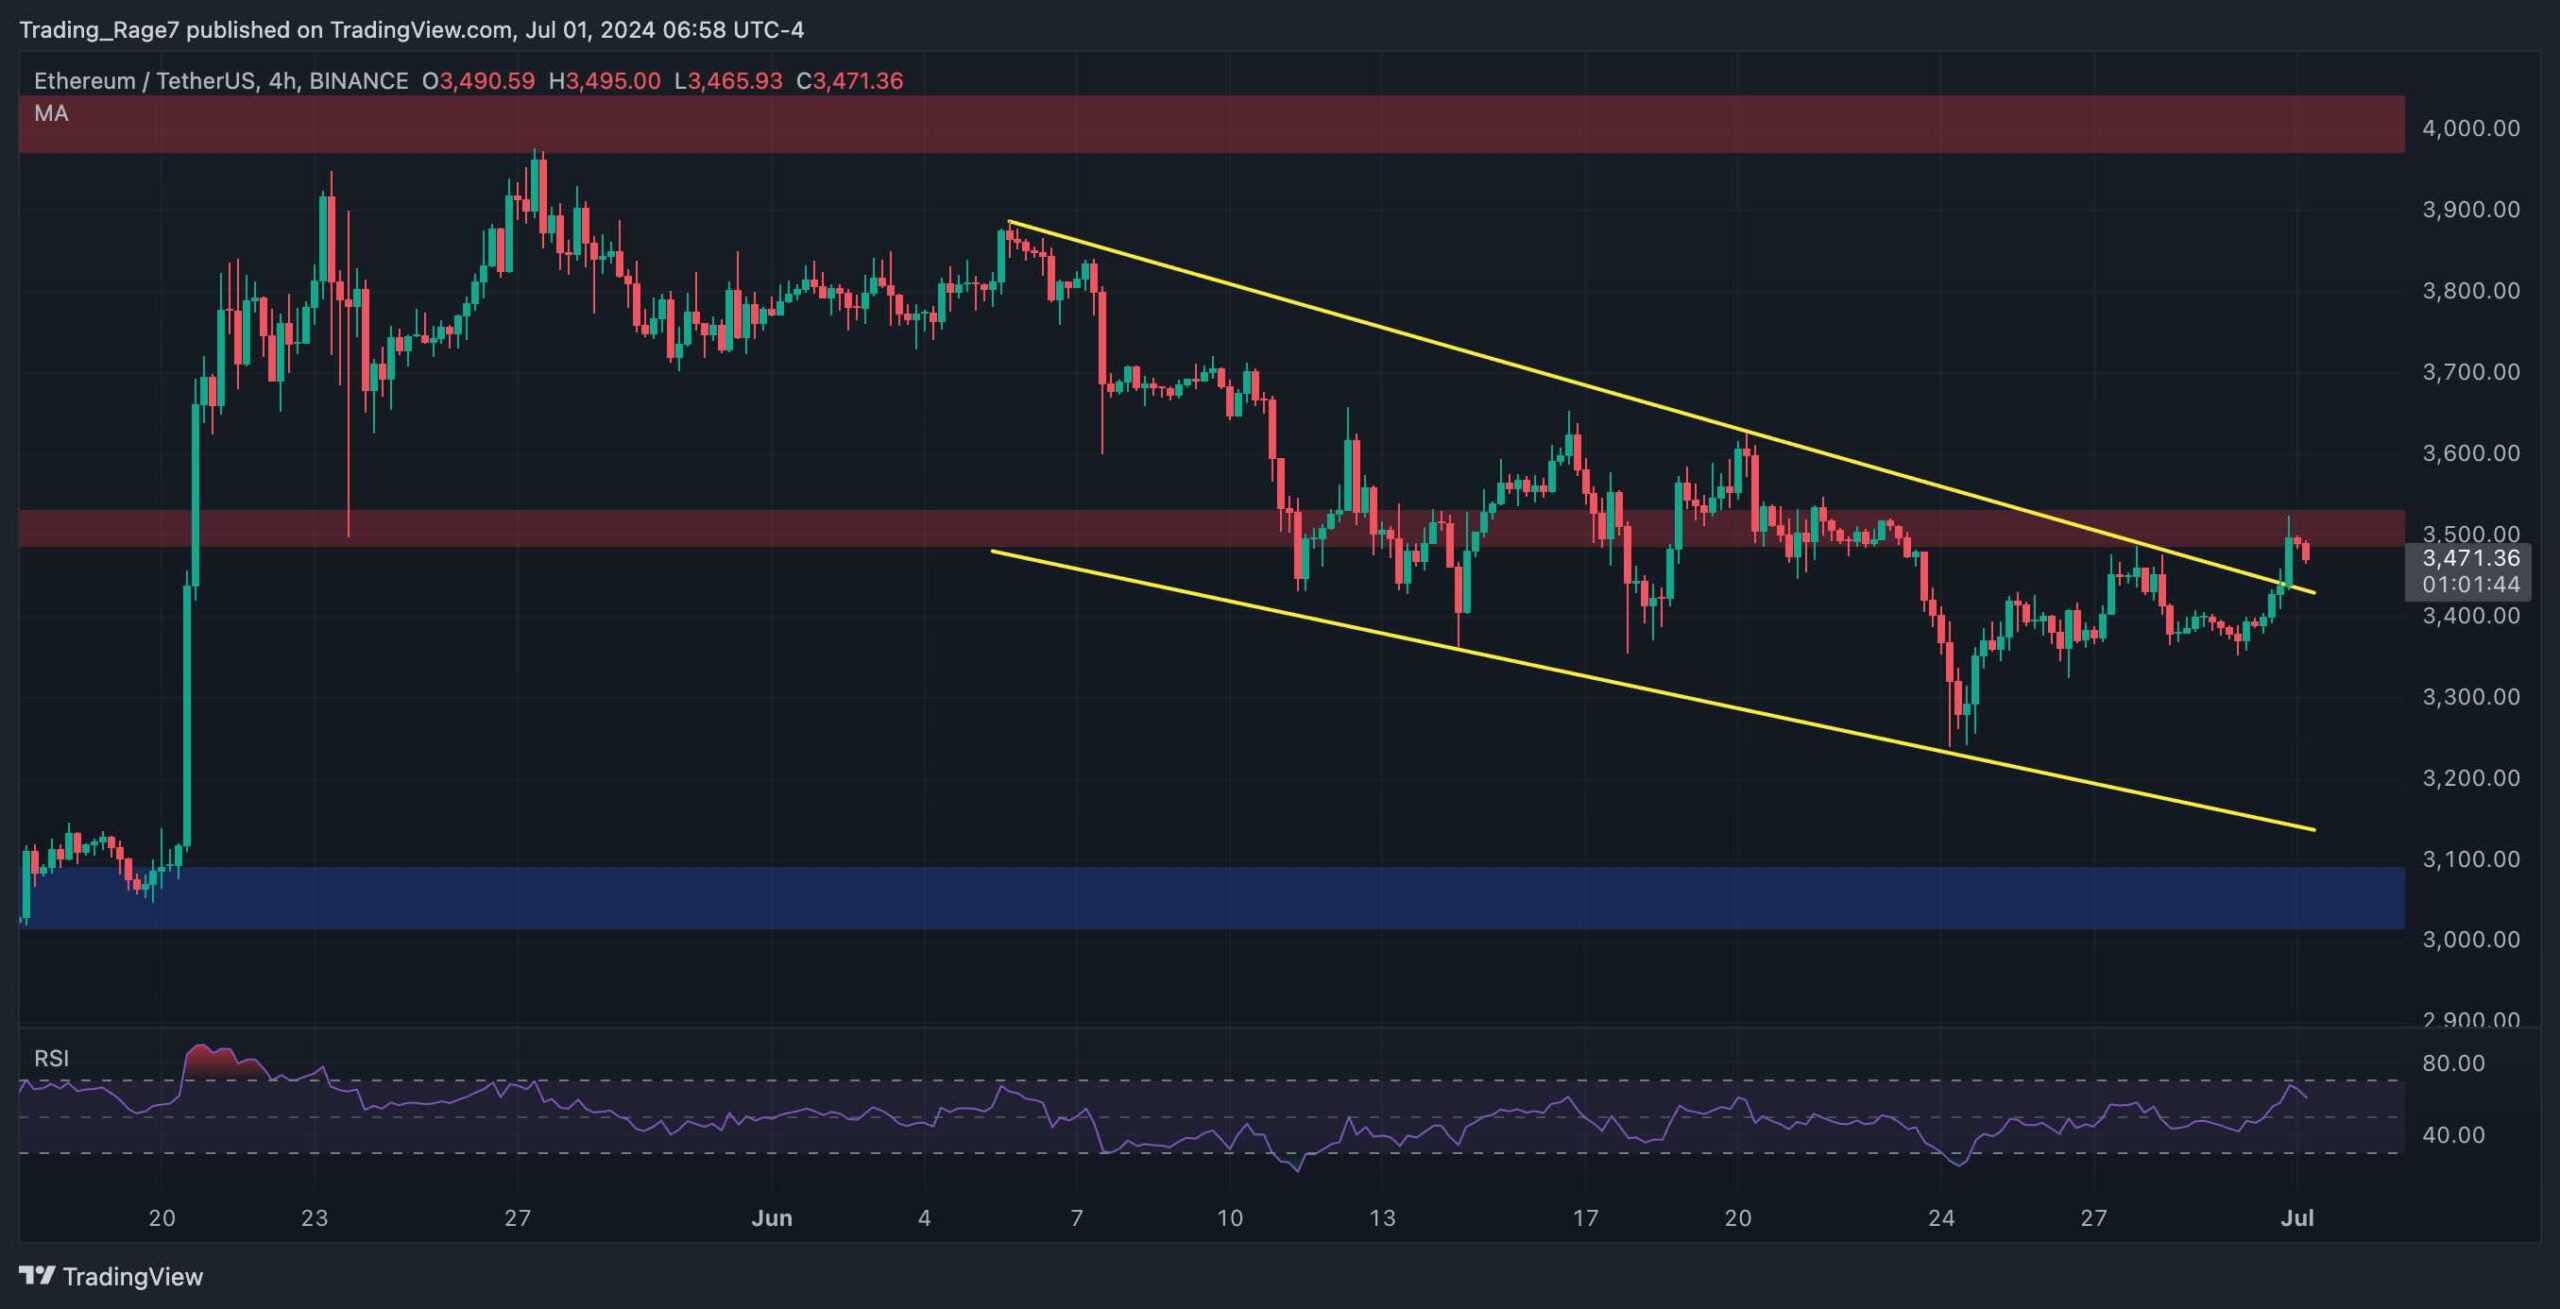
Looking at the 4-hour timeframe, some early signs of bullish reversal are surfacing. The price has just broken above the large descending channel pattern.
However, it is currently struggling to break through the $3,500 resistance level.
Yet, with the RSI indicating that the momentum is bullish, the market might be able to break higher and begin the next upward move. However, this scenario would fail if the price drops back inside the channel.
Sentiment Analysis
By TradingRage
Funding Rates
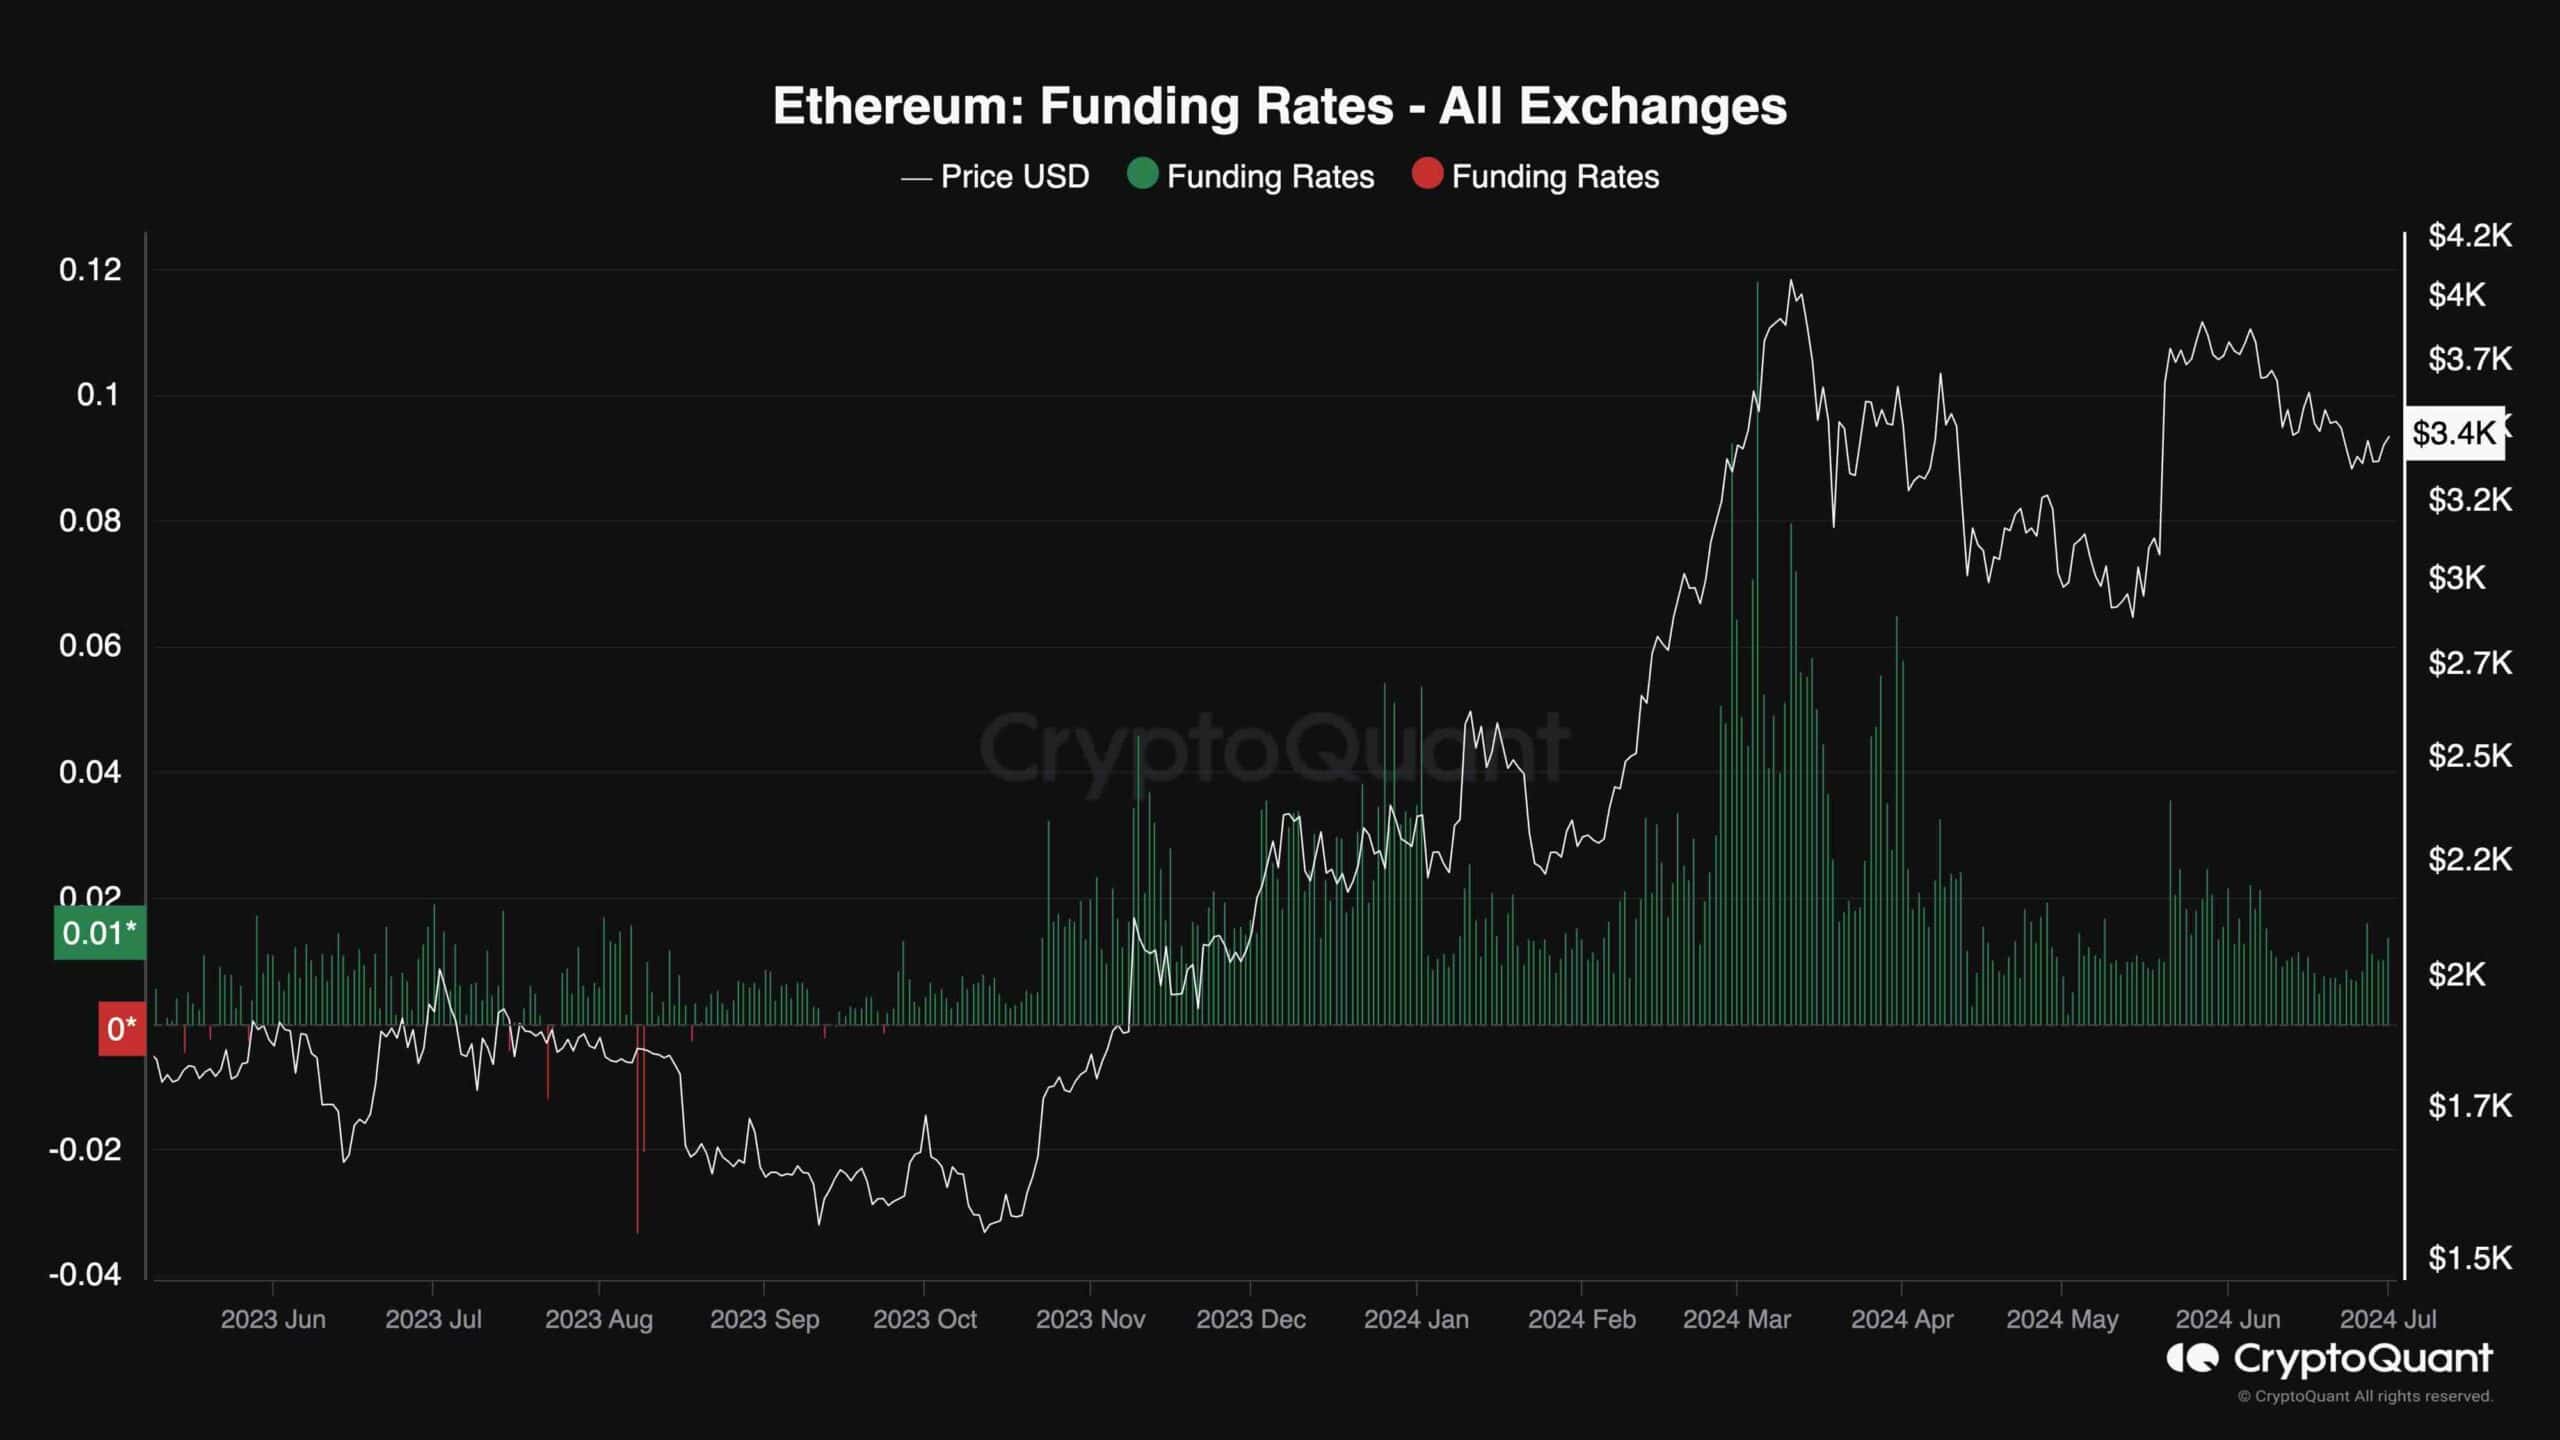
To complement the technical analysis above, it would be advantageous to analyze the futures market sentiment metrics. This chart shows the funding rates metric, one of the key sentiment parameters. It shows whether buyers or sellers are executing their futures orders more aggressively.
As the chart demonstrates, the funding rates have been gradually decreasing since the first price rejection from the $4,000 level back in March. The current funding rate values indicate that the futures market is no longer overheated, and the price could finally begin another sustainable rally higher.