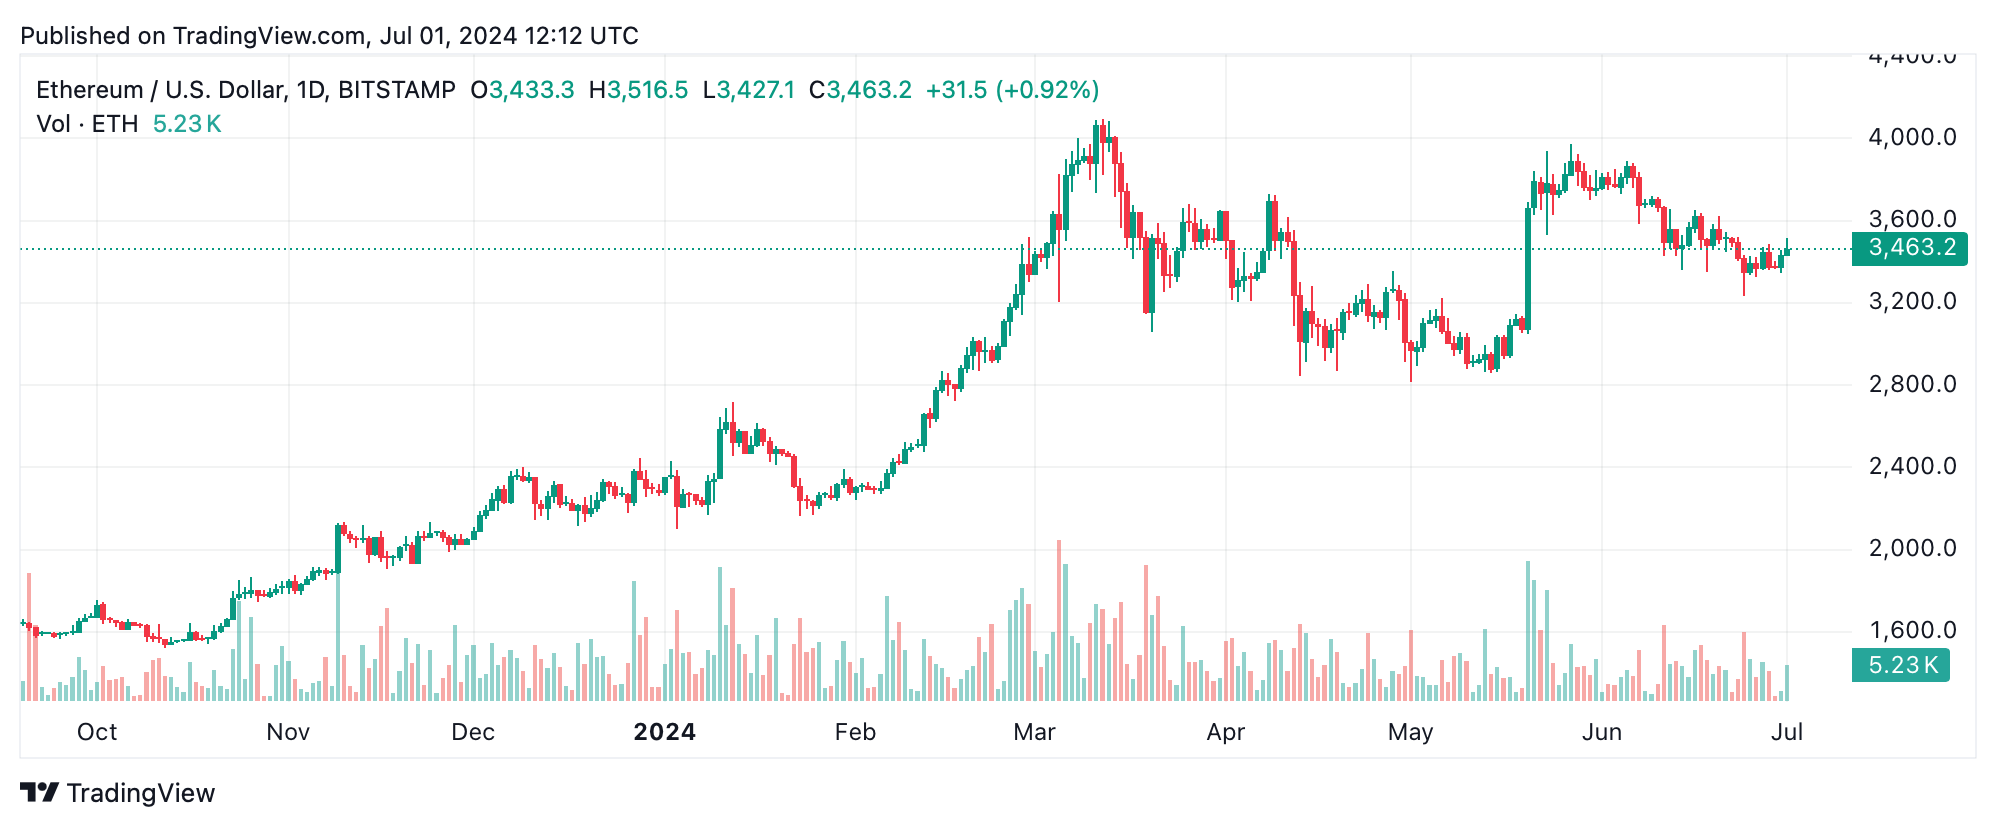
On July 1, 2024, at 8 a.m. EDT, ethereum is trading for $3,457, with an intraday price range between $3,374 and $3,514. The 24-hour trading volume reached $10.35 billion, contributing to a market capitalization of $415 billion on Monday morning.
Ethereum
The ETH/USD 1-hour chart highlights a strong uptrend originating around $3,348. The sharp rise indicates strong bullish momentum. Optimal entry points could have been identified at $3,348, as the uptrend gained strength. The recent peak at $3,520 serves as a crucial exit point, particularly if price action displays hesitation or reversal patterns.
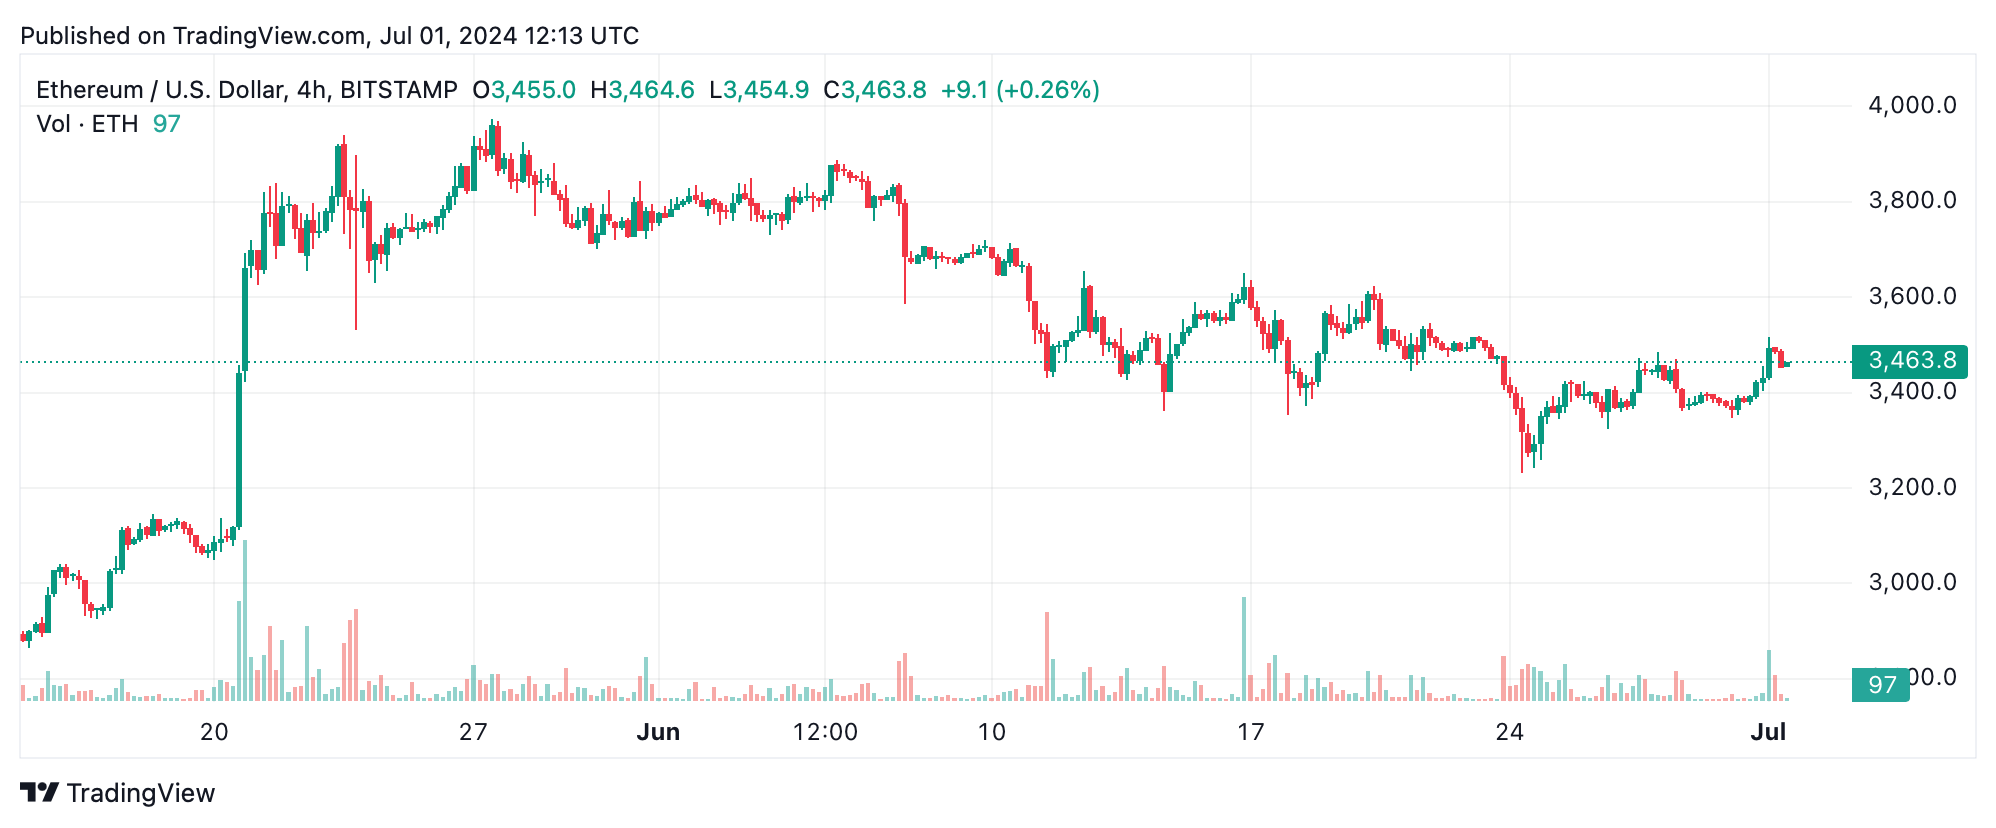
The 4-hour chart further emphasizes the upward trajectory, showcasing substantial upticks following the breakout past $3,400. This confirms the bullish sentiment observed on the 1-hour chart. A strategic entry zone was identified between $3,325 and $3,400 during the consolidation phase. Given the rapid climb to $3,520, the $3,600 range stands as a potential short-term exit point, especially amidst signs of increased selling pressure.
Daily chart analysis reveals a descending trend through June, interrupted by several rebounds. Recent data suggest a potential reversal, with prices moving above $3,400. The support level at $3,225, tested multiple times in June, may present a solid entry opportunity. With the price pushing past $3,500, bullish sentiment strengthens, targeting an exit near the previous resistance at $3,900, should the price approach this threshold again.
The oscillators offer mixed signals, with the relative strength index (RSI) at 47.8 and Stochastic at 46.8 both indicating neutrality. The commodity channel index (CCI) at -1.1 and the average directional index (ADX) at 25.5 also suggest a lack of definitive trend direction. However, the momentum (10) indicator shows a bullish signal at -61.4, while the moving average convergence divergence (MACD) level at -44.8 recommends selling, reflecting some market indecision.
Moving averages (MAs) provide a clearer picture. The 10-period exponential and simple moving averages (EMAs and SMAs) are bullish at $3,431 and $3,410, respectively. Conversely, 20, 30, and 50-period EMAs and SMAs indicate selling pressures, reflecting mixed short to medium-term sentiment. However, 100 and 200-period moving averages remain bullish, suggesting longer-term strength in ethereum’s price trajectory.
Bull Verdict:
Ethereum’s price action on July 1, 2024, indicates strong bullish momentum, especially evident in the short-term charts. The recent breakout past $3,400, coupled with bullish signals from the 10-period moving averages and positive momentum indicators, suggests that ether could continue its upward trajectory. Long-term MAs also support a positive outlook, making this an opportune moment for bullish investors to capitalize on potential gains.
Bear Verdict:
Despite the current bullish signals, several indicators suggest caution. The mixed signals from oscillators and the selling pressures indicated by the 20, 30, and 50-period moving averages highlight potential vulnerabilities in ethereum’s price. The recent peak near $3,520 may face resistance, and any signs of reversal or increased selling volume could indicate a bearish turn, making it prudent for bearish traders to consider exiting positions or hedging against potential downturns.
What do you think about ether’s performance? Share your thoughts and opinions about this subject in the comments section below.