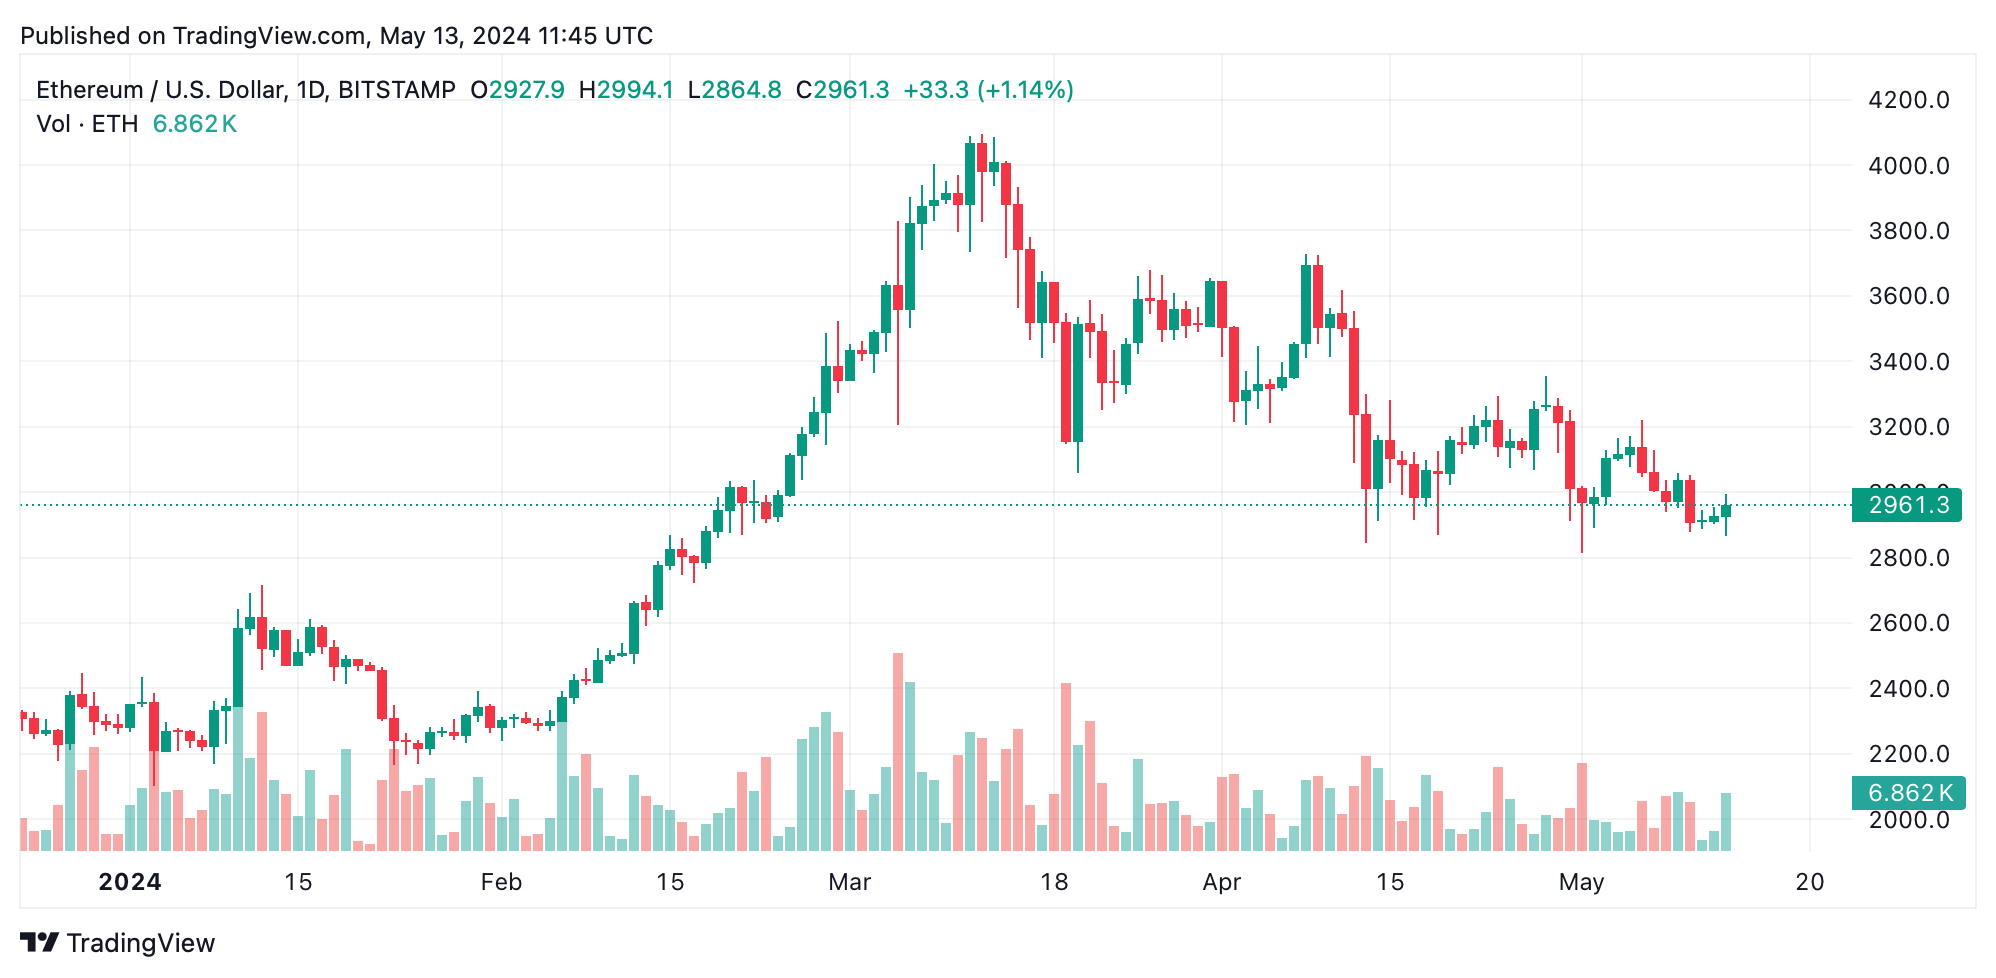
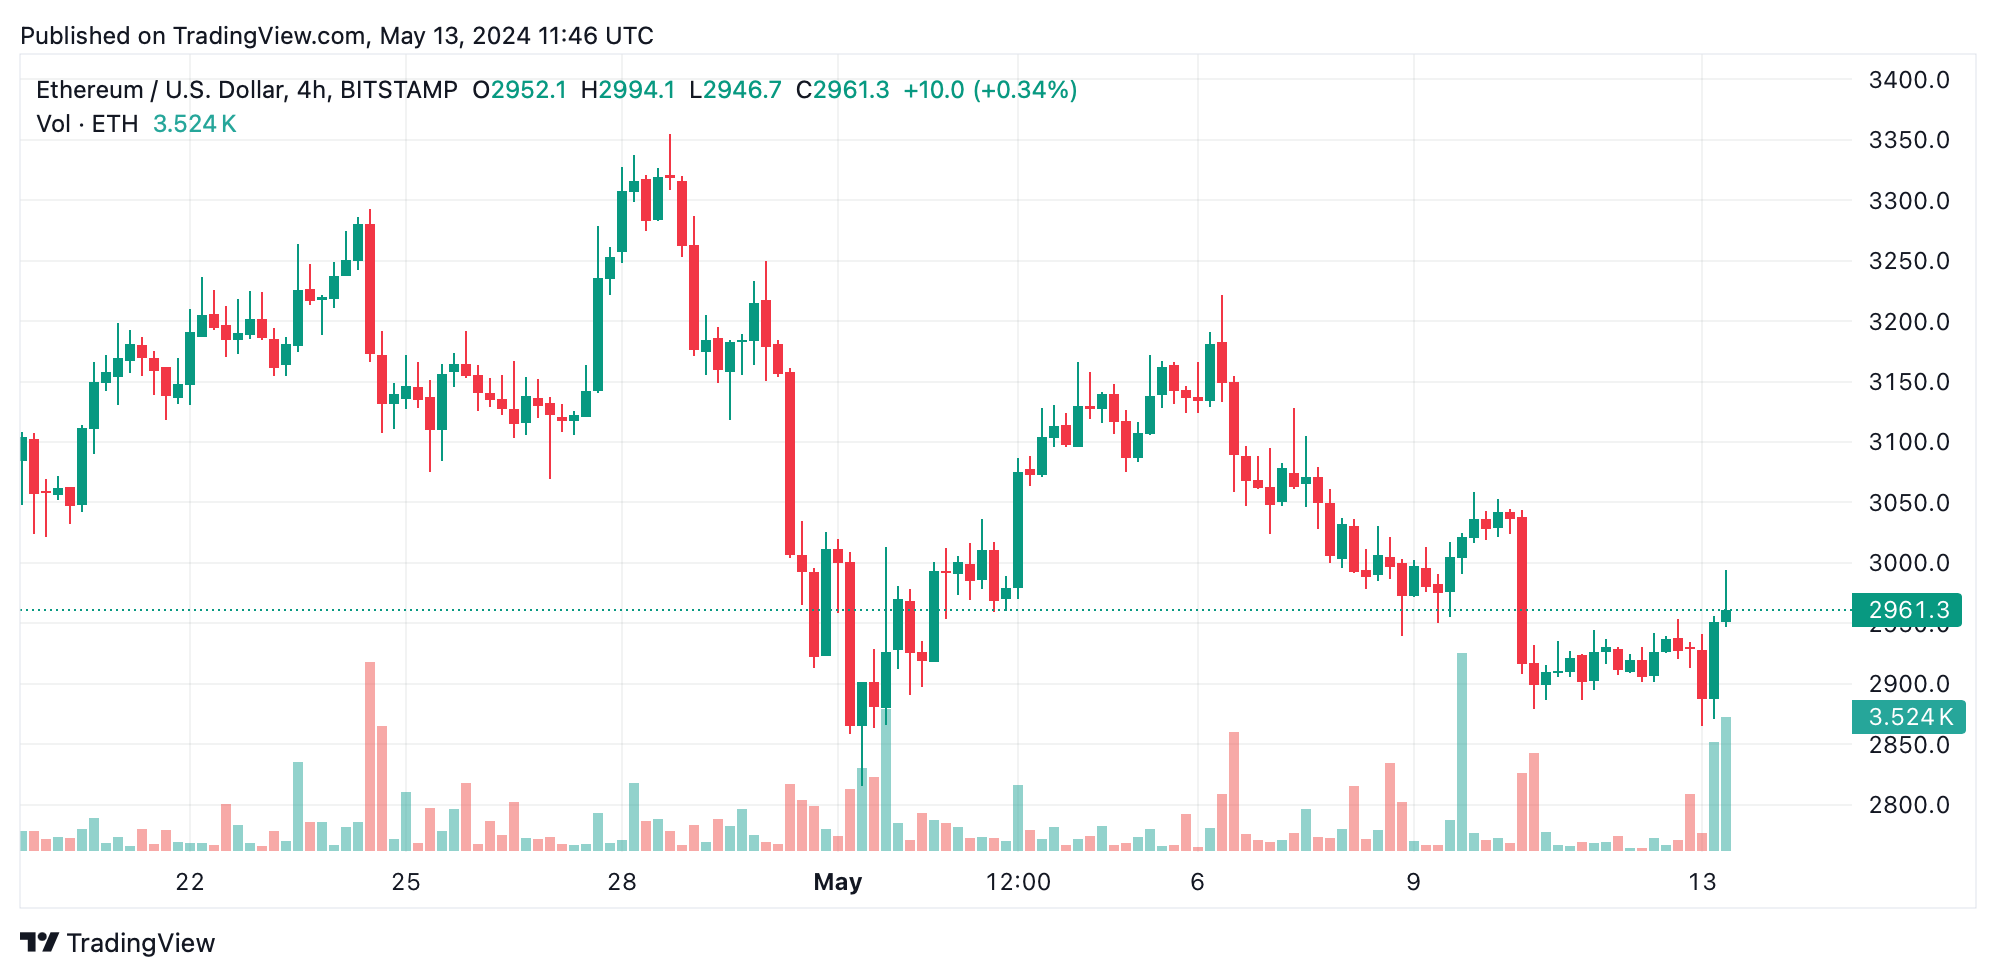
As of May 13, 2024, ethereum presents a complex landscape for traders, characterized by fluctuating prices and diverse market signals. Despite a slight 1% uptick over the past day, the broader perspective shows a week marked by a 6.1% decline, setting a cautious tone for ether traders.
Ethereum
The ETH/USD daily chart indicates a prevailing downtrend, with ethereum’s price swinging from highs around $3,600 to lows near $2,800. Recent trading sessions have displayed bullish signs, hinting at a possible reversal or at least a short-term reprieve from the downtrend. Traders should watch for a breakout above $3,200 as a sign of potential bullish momentum, suggesting a possible shift in the market sentiment.

The 4-hour chart offers a granular view of ethereum’s price action, highlighting a period of consolidation followed by a sudden drop and subsequent recovery. This recent volatility introduces uncertainty, although the latest upswing may indicate emerging bullish momentum. Traders might consider entering long positions if ether consistently holds above the $3,000 threshold, signaling sustained buyer interest.

On the 1-hour ETH/USD chart, ether displays increased volatility with a clearer indication of an upward trend in the very short term. Strong bullish upticks suggest immediate upward momentum, making it an attractive scenario for short-term traders. A strategic entry could be considered around $2,900, leveraging recent support levels for a bullish bet with a tight stop-loss to manage risk effectively.
Oscillators like the relative strength index (RSI), Stochastic, and moving average convergence divergence (MACD) levels present a predominantly neutral to bearish outlook, with specific indications for a sell on momentum and MACD levels. Such signals are crucial for traders focusing on short-term price movements and could point to underlying weaknesses in the current market structure.
Most moving averages (MAs) on ETH/USD charts signal bearish sentiment, particularly in the short to medium terms (10, 20, 50, 100-day periods). However, the 200-day moving averages, both simple and exponential, suggest a bullish optimism, indicating potential long-term support levels at significantly lower prices, which might serve as a strong entry point for long-term traders.
Bull Verdict:
Given the current technical indicators and ethereum’s price action, there’s a cautiously optimistic outlook for bullish investors. The recent bullish upswing on the daily chart, coupled with a potential stabilization above $3,000 on the 4-hour chart, suggests that if these levels hold, we might see an upward momentum. The presence of long-term buying signals from the 200-day moving averages further supports a bullish scenario, indicating that ethereum could be gearing up for a recovery if broader market conditions remain favorable.
Bear Verdict:
Conversely, the bearish verdict is underscored by the predominance of negative sentiment across most MAs and the bearish momentum coupled with the MACD levels. The persistent downtrend observed on the daily chart and the considerable volatility without clear direction on shorter timeframes suggest that ethereum might continue to face downward pressure. If the price fails to sustain above the critical $3,200 threshold, it could reaffirm the bearish trend, leading to further declines as market sentiment remains wary.
 news.bitcoin.com
