- When examining Ethereum
’s daily chart, it’s noted that an upward movement started from the previous support, but today experienced a 1.15% decline. - If the ETH price fails to achieve 4-hour closures above $3,272, it may continue its decline towards the support range of $3,071 – $3,034.
- In case of encountering strong buyers, Ethereum may aim to restart the upward trend, hence investors should closely monitor the $3,071 – $3,034 support range.
Ethereum’s daily chart is down 1.15% today despite a rally from previous support, candle closes above $3272 are important.
MEDIUM TERM ETH ANALYSIS
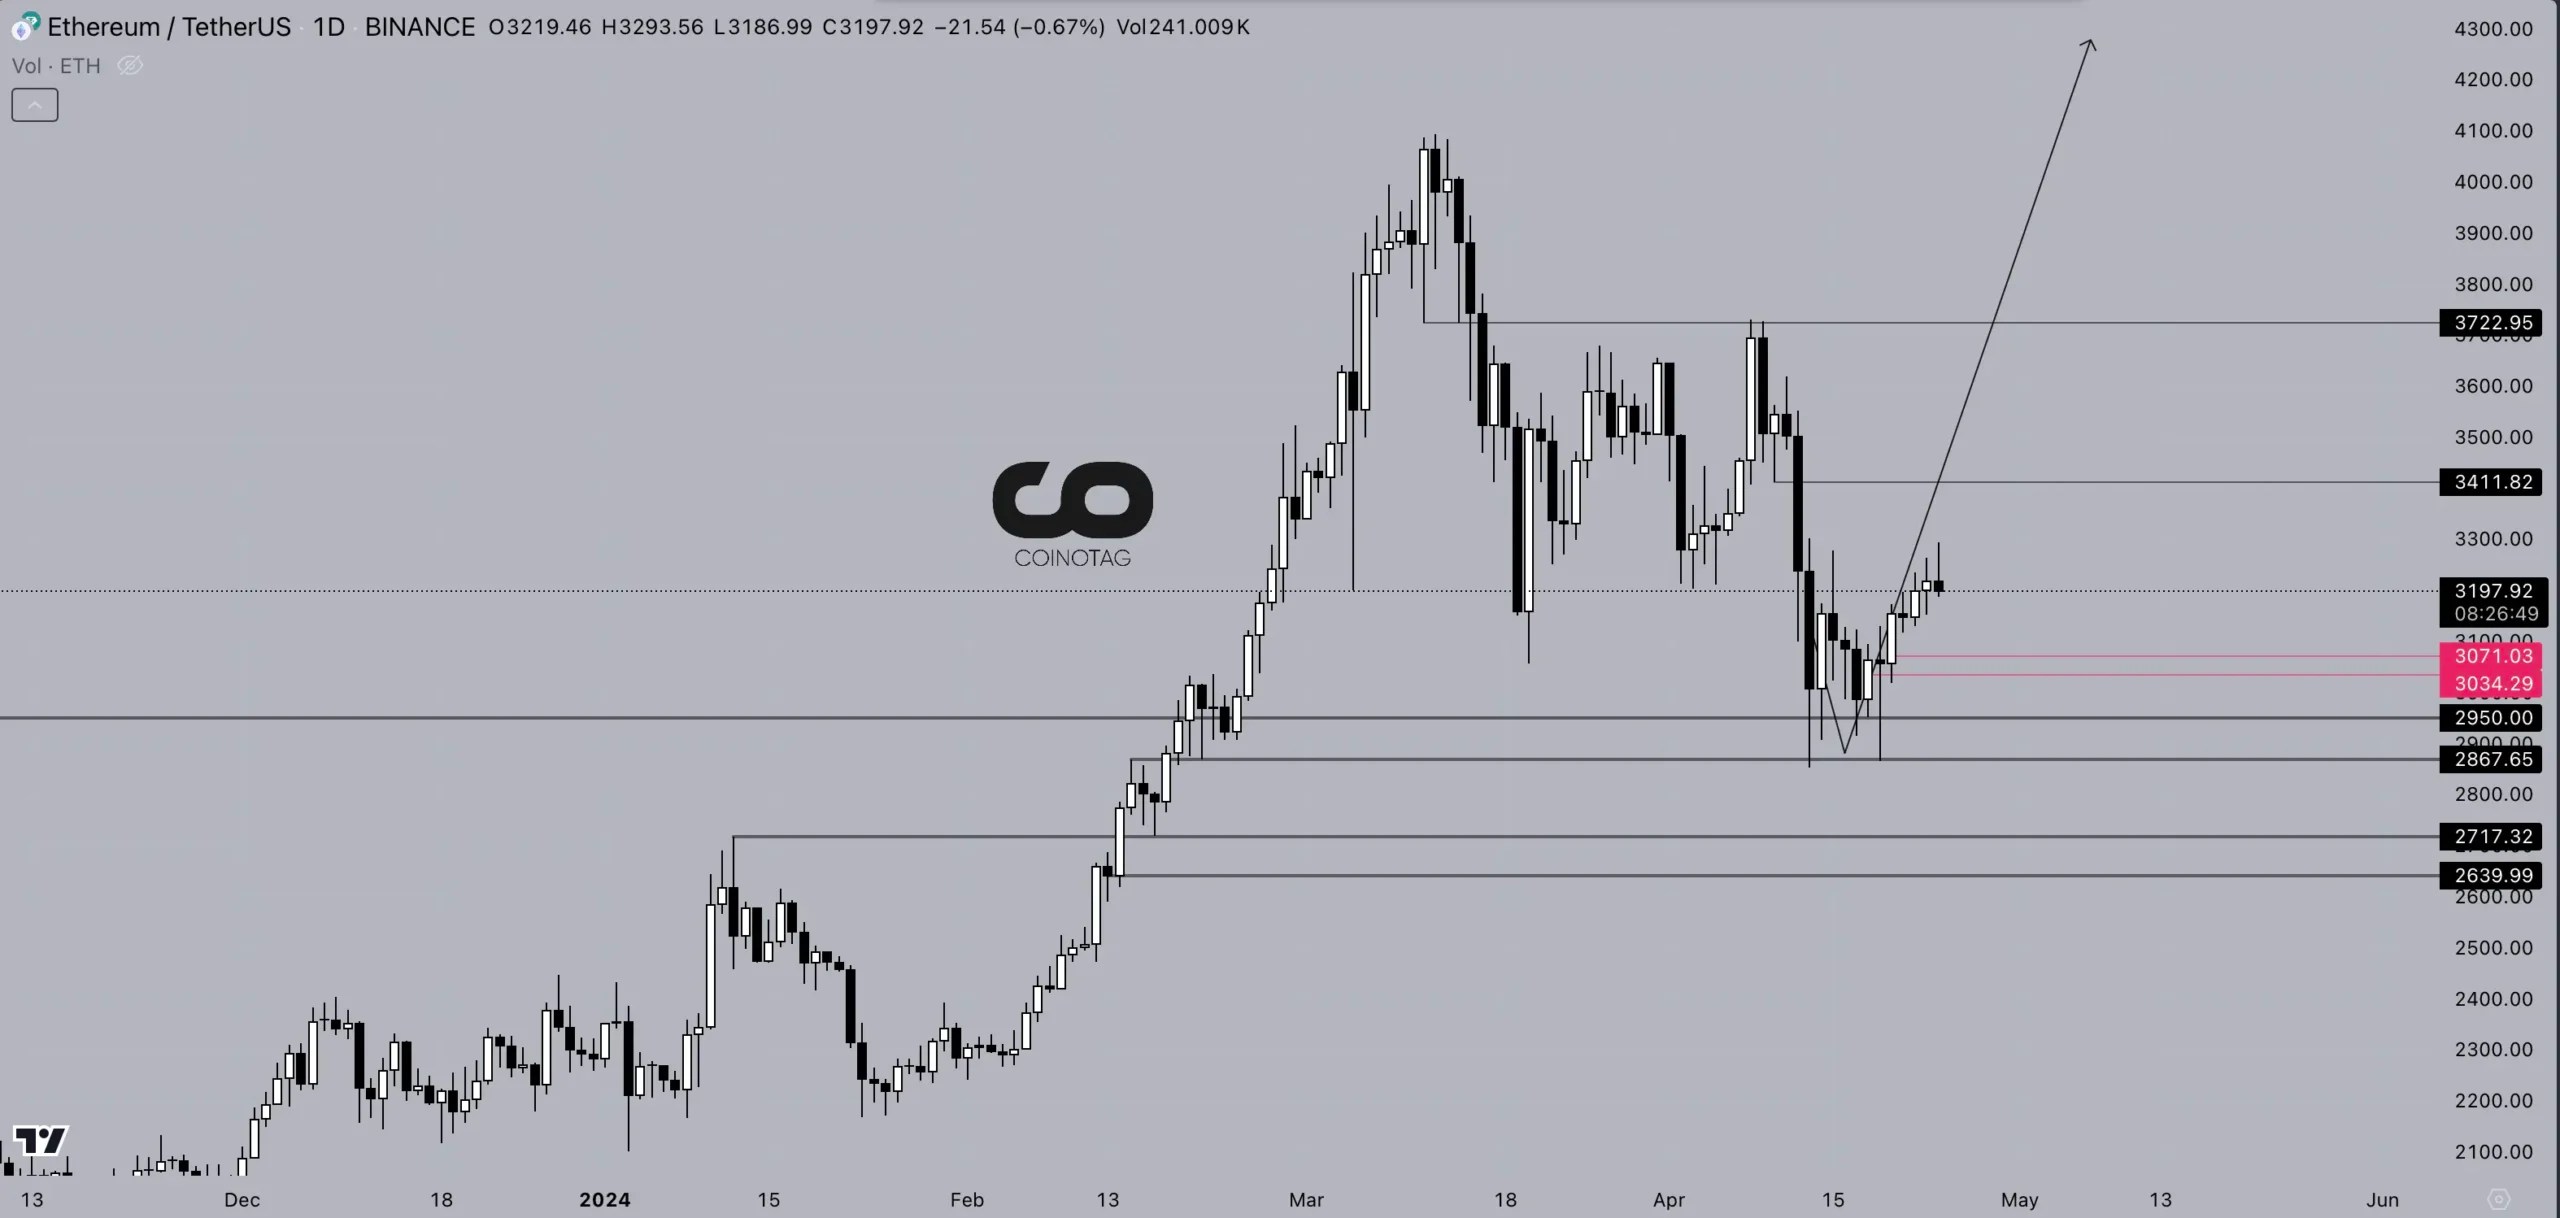
When examining the daily technical chart of Ethereum, it can be observed that it attempted to initiate an upward movement from the previously mentioned support zone but experienced a decline today. ETH price retreated to the $3,176 levels with a 1.15% decrease.
Unless the ETH price achieves 4-hour candle closes above the $3,272 level during the day, the downward trend may continue towards the support range of $3,071 – $3,034. However, if the ETH price encounters strong buyers at the red line supports mentioned in the analysis, it may aim to restart the upward trend.
Therefore, ETH and altcoin spot investors need to carefully monitor the $3,071 – $3,034 support range. In fact, if ETH falls into this zone, they can evaluate their spot investments by paying attention to whether it closes daily candles below $2,867.
If ETH manages to rebound from the red support levels in the analysis, the upward targets will be $3,414 – $3,722 respectively.