As ethereum fluctuates within a wide trading range from $2,991 to $3,266 on April 15, 2024, key technical indicators and chart patterns suggest a nuanced but potential shift in market sentiment. Despite a bearish trend over the past week, recent oscillator and moving average signals point towards a possible bullish reversal.
Ethereum
The relative strength index (RSI), hovering at 44.8, reflects a neutral sentiment among traders, indicating that ether is neither overbought nor oversold at this moment. Meanwhile, other oscillators like the Stochastic and commodity channel index (CCI) reinforce this neutrality, suggesting that immediate directional moves might be limited. However, the Momentum oscillator slightly tips towards a buying action, hinting at emerging bullish undertones.
A critical look at the moving averages reveals a mixed sentiment. Short-term moving averages (10, 20, 30, 50-day) predominantly signal bearishness due to prices trending below these averages, reflecting recent bearish momentum. Conversely, the long-term outlook, evidenced by the 100 and 200-day exponential moving averages, suggests a buy, indicating potential long-term recovery or stabilization.
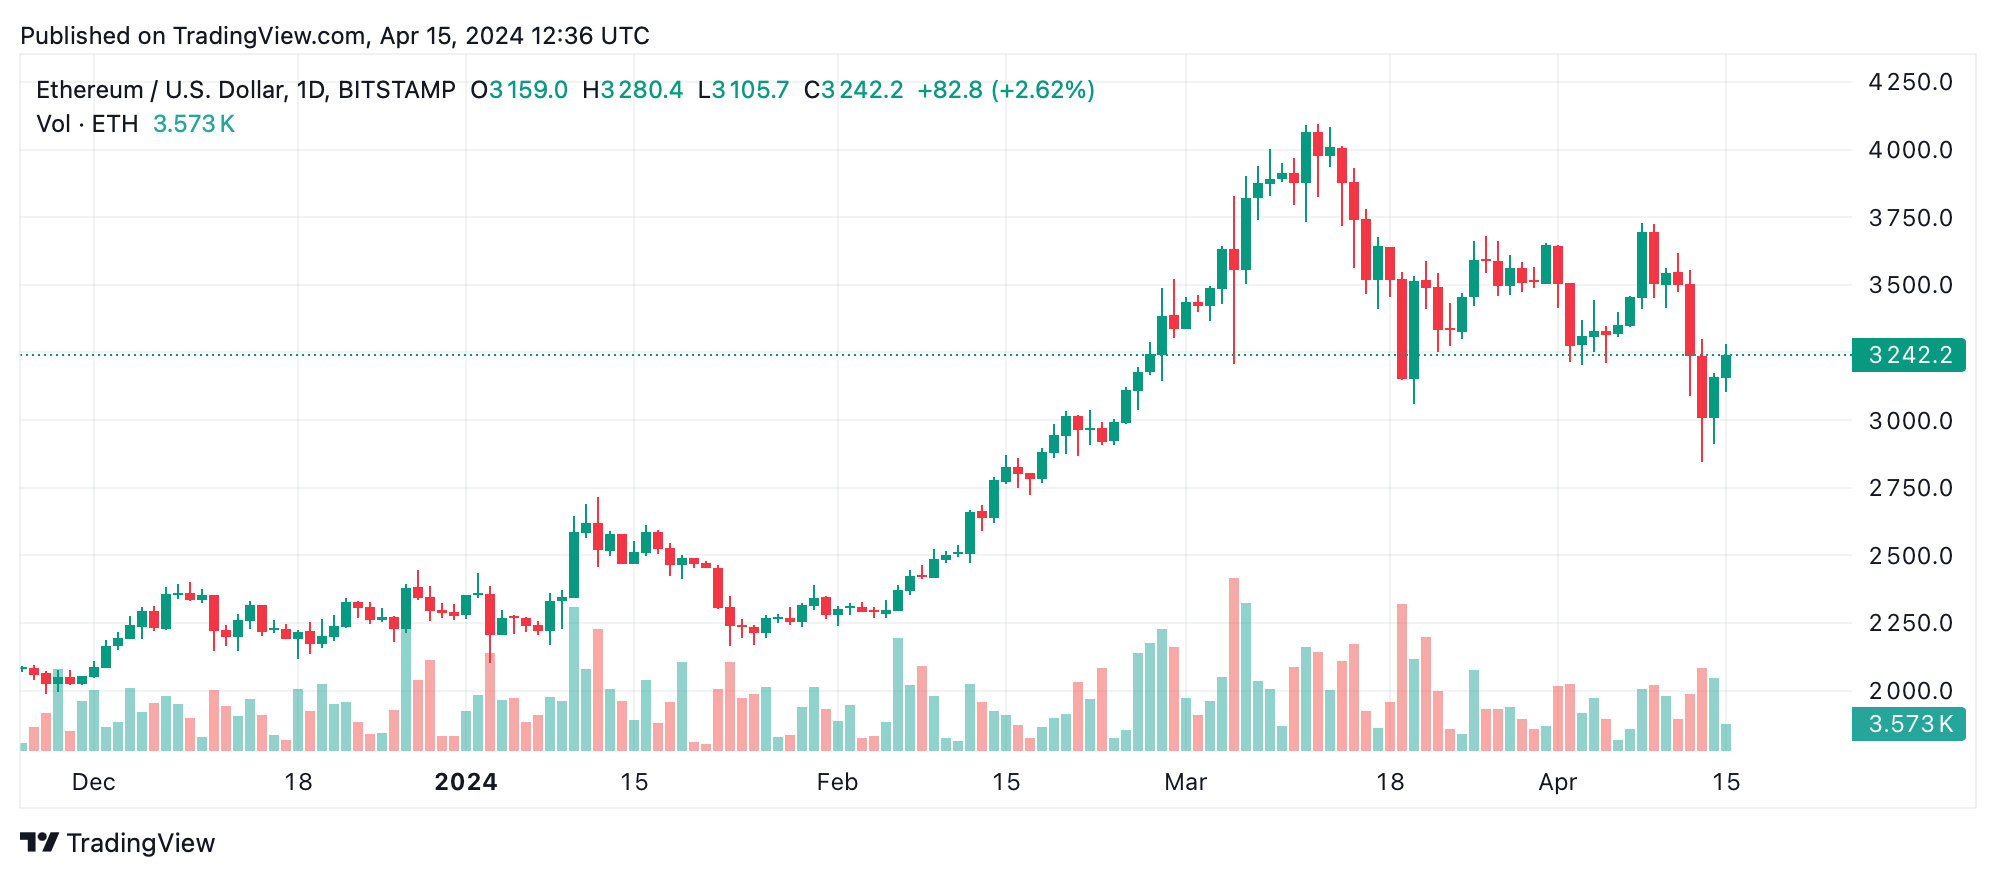
The daily chart analysis points to a recent downtrend followed by what might be the beginning of a bullish reversal. This observation is supported by a significant green candle, which suggests a shift in market sentiment. Traders might consider a cautious entry if further bullish patterns emerge, aligning with higher volumes on upward price movements.
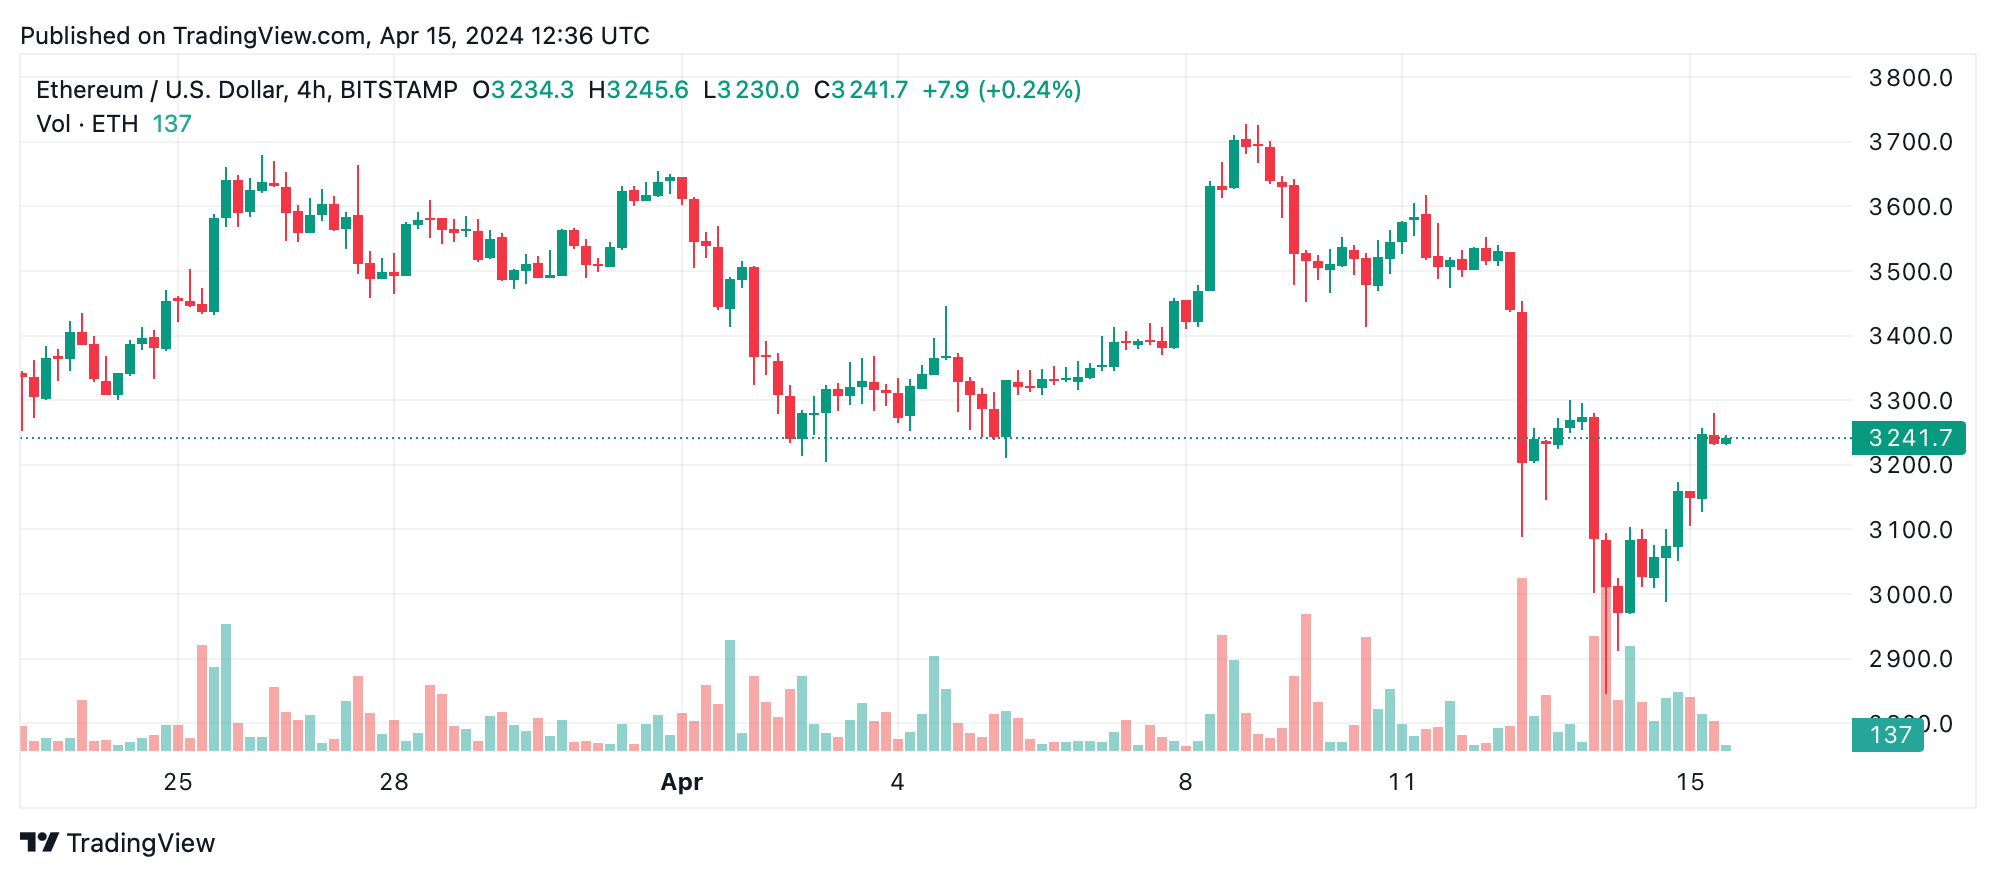
The 4-hour chart presents a more optimistic scenario with a clear transition from a bearish to a bullish trend, marked by higher lows and higher highs. This chart suggests a consolidation phase might be nearing its end, offering a strategic entry point around the $3,000 support level for bullish investors.
Short-term analysis through the 1-hour chart confirms the bullish sentiment with consistently higher lows. This trend is accompanied by increased volume during both uptrends and downtrends, indicating heightened market activity and possible indecision that could precede a stronger directional move.
Bull Verdict:
The technical setup for ethereum, particularly the positive divergence on long-term moving averages and the emergence of bullish patterns in shorter time frames, suggests a potential turnaround from recent declines. If the market sustains the uptrend signaled by the 4-hour and 1-hour charts, traders might see this as an opportune moment for entry, anticipating further gains as support levels solidify and resistance points are tested.
Bear Verdict:
Despite intermittent signals of bullish intent, the prevailing market conditions for ethereum remain tethered to a bearish backdrop, as evidenced by the majority of moving averages’ bearish signals. The uncertainty highlighted by neutral oscillator readings and high volatility underscores the potential for further downside, especially if ethereum fails to maintain its hold above critical support levels.