In a demonstration of resilience and bullish momentum, ethereum’s price spiked over the $3,600 threshold, marking a significant increase within a 24-hour range that saw lows of $3,372 and highs of $3,644. This uptrend is underpinned by a strong trade volume of $13.40 billion and a market capitalization of $434 billion, indicating sustained interest in ether.
Ethereum
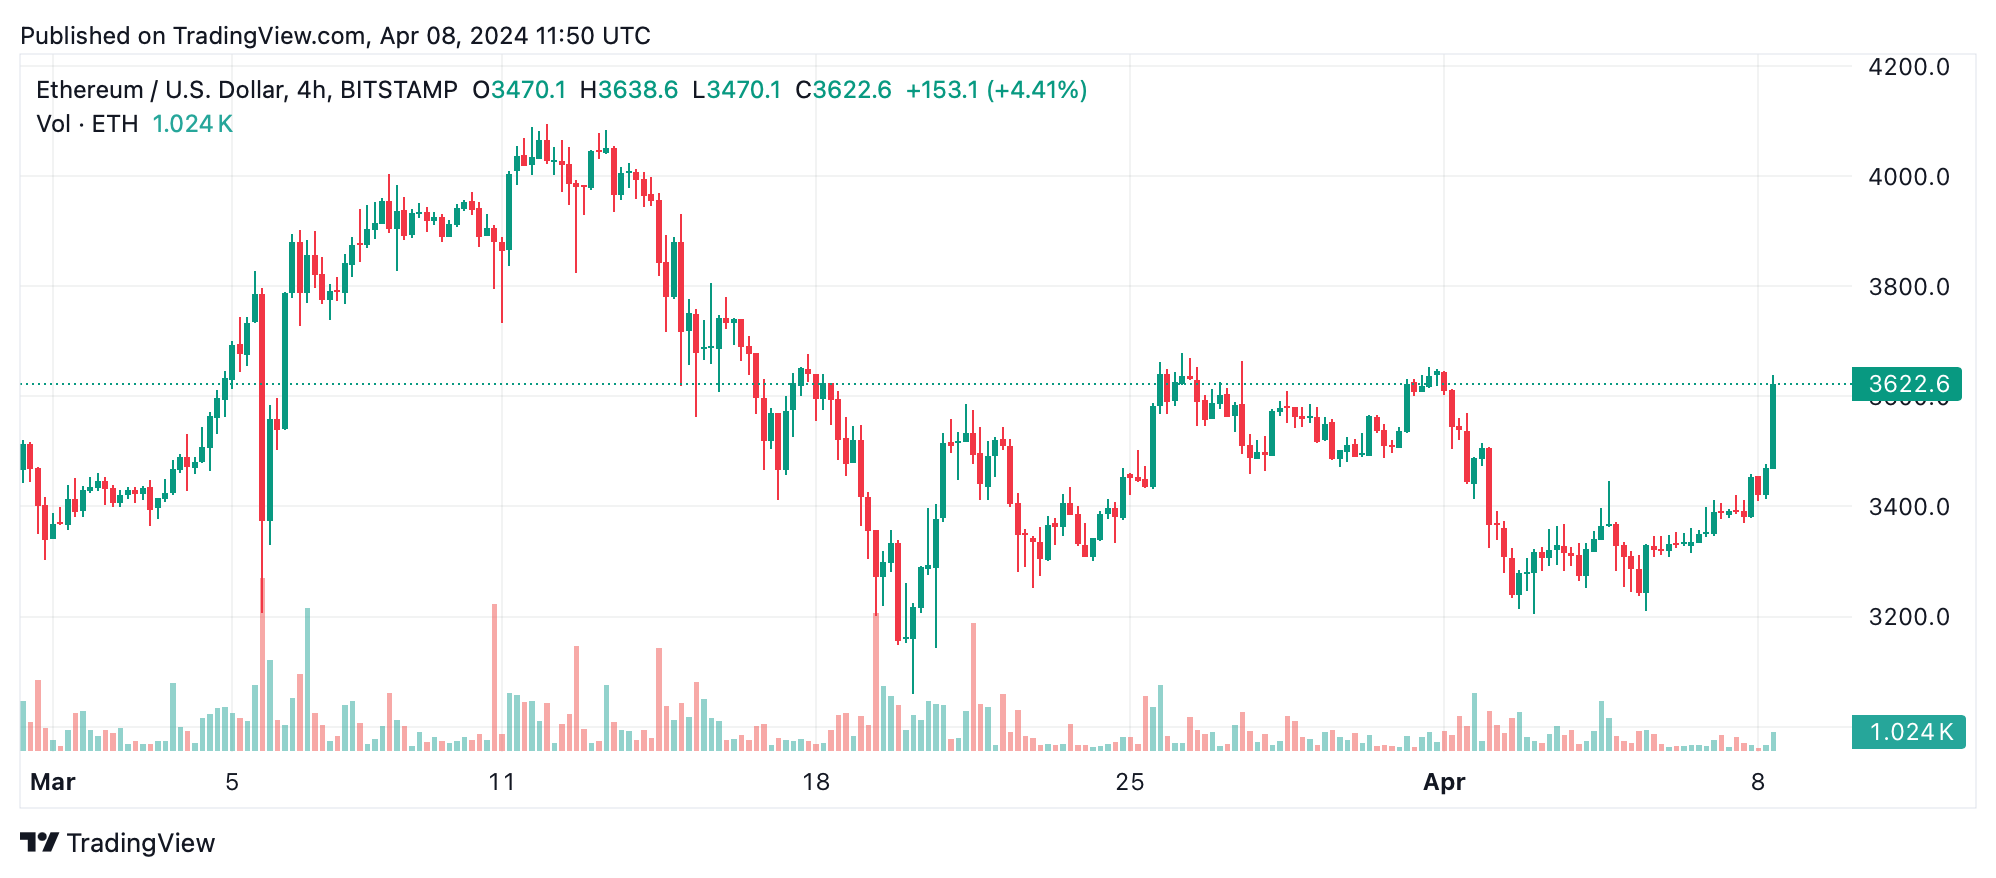
The 1-hour chart analysis reveals a vivid portrayal of ethereum’s (ETH) strong buying pressure, characterized by large upswings and minimal retracement from recent highs. This pattern indicates a sustained interest in ether, potentially signaling the continuation of its upward trajectory. Traders might find promising entry points following small retracements or periods of consolidation that hint at ongoing upward momentum. Turning to the 4-hour chart, the clarity of ETH’s uptrend becomes even more pronounced.
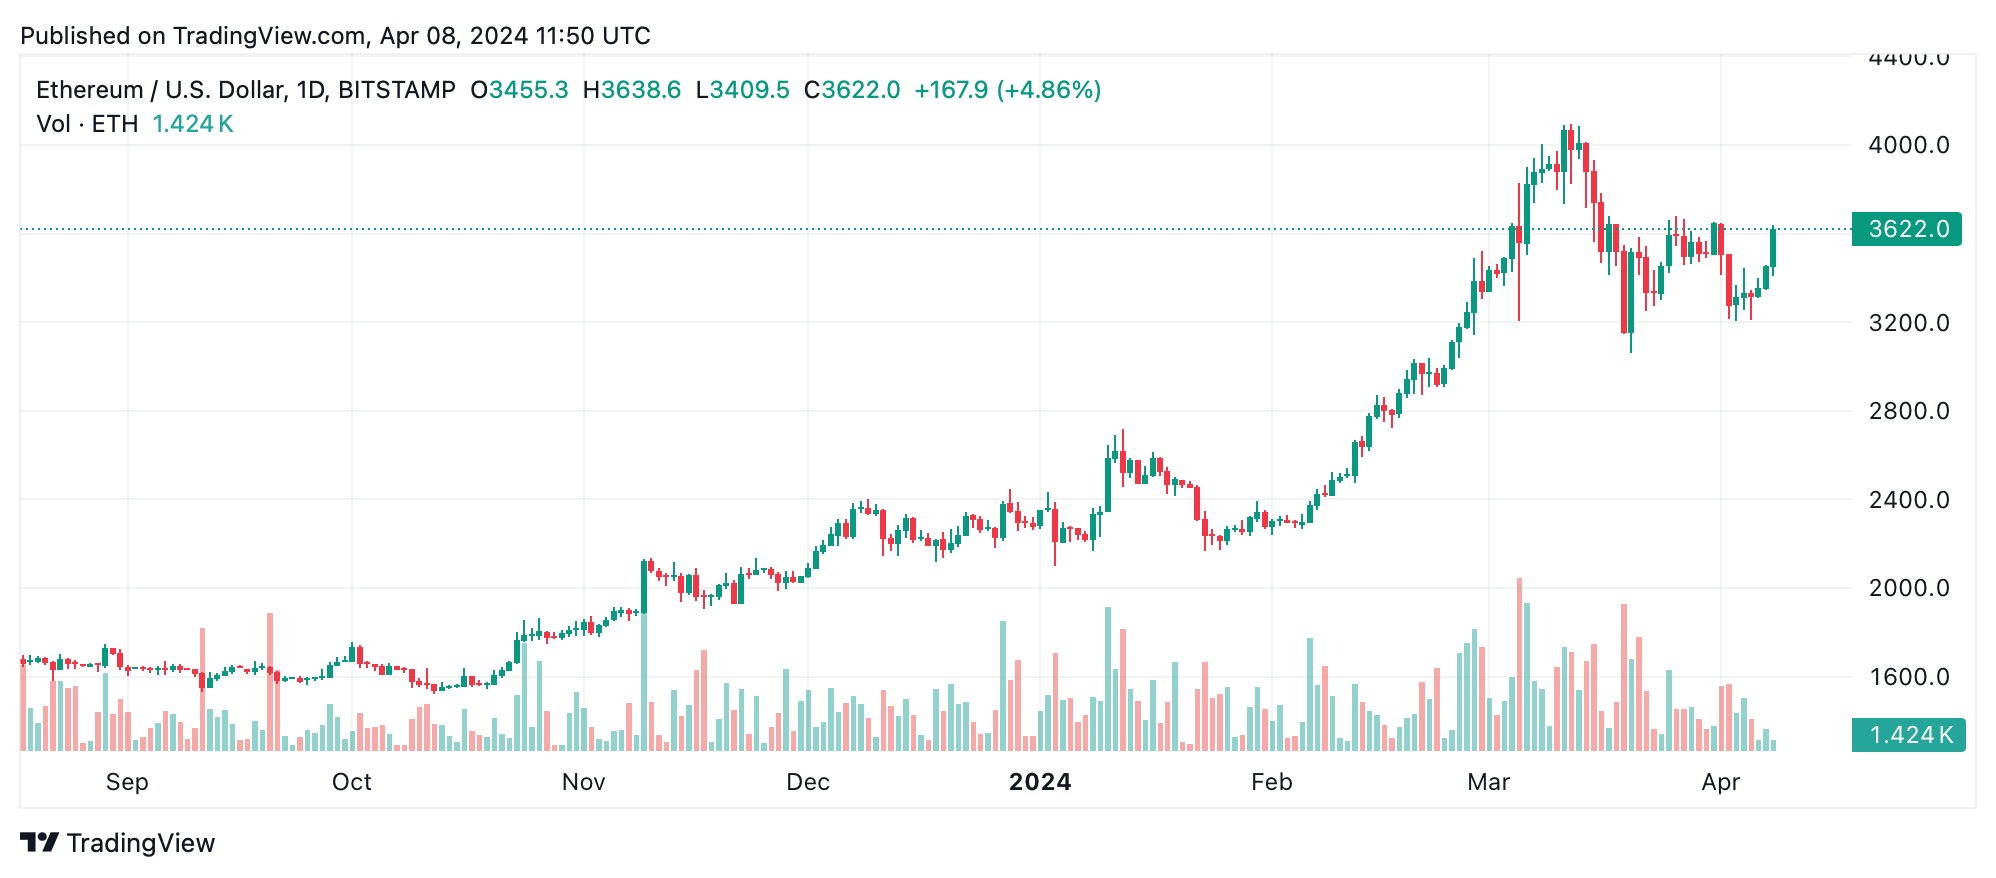
This timeframe highlights the market’s consistent higher highs and lows, a classic signal of a strong and enduring uptrend. Swing traders should eye pullbacks to key support levels or moving averages for optimal entry points, with the last uptick indicating a potent market move. The daily chart offers the broadest perspective, showcasing ether’s recovery from lower levels around $3,055, followed by a consecutive series of bullish rises. Entry points on this scale should be validated by larger trading volumes and consistent closing prices above significant support levels.
Conversely, exit signals may arise from bearish candlestick patterns at the peak of the uptrend or a close below the trendline, indicating a potential reversal. Oscillator indicators present a mix of neutral and directional signals, with the relative strength index (RSI), Stochastic, and commodity channel index (CCI) all hovering in neutral territories.
However, the momentum indicator suggests a bullish signal, contrasting with the moving average convergence divergence (MACD) level, which signals a bearish sentiment. This divergence indicates a market at a crossroads, with potential for either continuation or correction. The moving averages (MAs) overwhelmingly favor a bullish stance, with buy signals across both short-term and long-term averages. This alignment suggests a solid underpinning for the current price trend, reinforcing the likelihood of continued upward movement in ether’s price.
Bull Verdict:
Ethereum’s current technical landscape beams with bullish signals, from the robust buying pressure illustrated on the 1-hour chart to the consistent pattern of higher highs and higher lows on the 4-hour and daily charts. Coupled with predominantly positive MAs and a mixed yet optimistic outlook from oscillators, the momentum is strongly in favor of the bulls. The market’s resilience, backed by a substantial market capitalization and trade volume, suggests ETH is well-positioned for further gains.
Bear Verdict:
Despite the prevailing bullish sentiment in ETH’s market, several signals warrant caution for a potential shift toward bearish territory. The sell signal from the MACD contrasts with the overall bullish trend, suggesting underlying market hesitations. Additionally, the neutral stance of most oscillators, including the RSI, Stochastic, and CCI, indicates a market potentially at equilibrium, which could precede a trend reversal.