Ethereum price in the past month has generated billions of dollars in profits for its investors, following a 56% rally.
However, this will most likely be paused as the bull market has reached its saturation point, and ETH will begin a decline while the market cools down.
Ethereum Market Top Confirmed
Ethereum price could be seen trading at $3,921 at the time of writing. The second biggest cryptocurrency in the world has grown by 56% in the past month, rising from $2,500 to trading price.
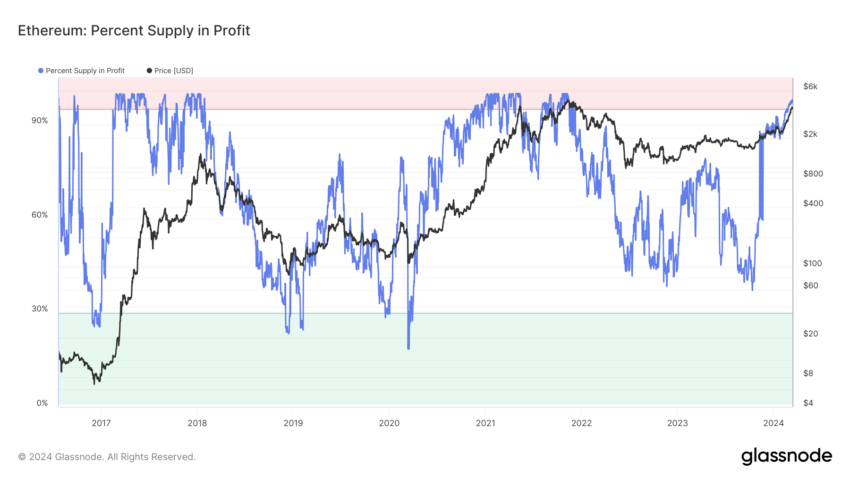
In doing so, the ETH in circulation also became profitable, and with the digital asset now less than 18% away from the all-time high of $4,626, the market top appears to have formed. A market top signifies the peak level attained by asset prices or indices before a subsequent decline. This often indicates a shift from bullish sentiment to potential downward trends or corrections.
Such a market top is formed when more than 95% of the circulating supply is in profit, and at the moment, 97.5% of the supply is in profit. The event last occurred in November 2021, when ETH formed the previous all-time high.
This confirms that a price fall is on the cards. Secondly, technical indicators are also turning bearish, confirming that the bull run is coming to a halt. The MACD (Moving Average Convergence Divergence) is a technical analysis indicator that measures the relationship between two moving averages of an asset’s price, helping identify trend reversals and momentum shifts.
MACD on the daily chart is on the cusp of forming a bearish crossover, with the histogram set to display red candles over the coming days. The same can be observed in the Relative Strength Index (RSI).
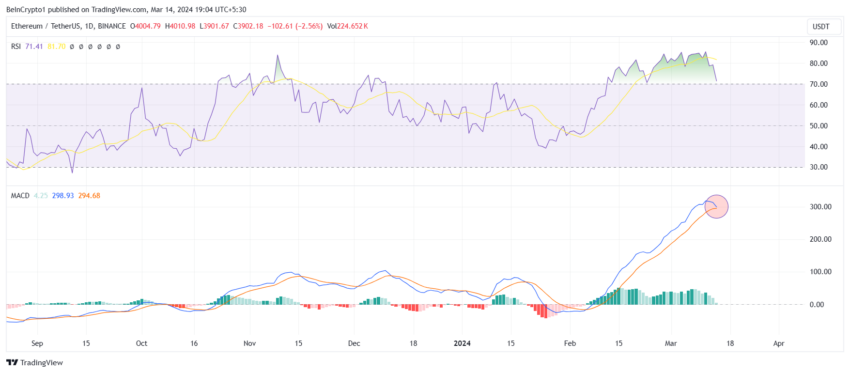
This is a momentum oscillator gauging the speed and change of price movements to identify overbought or oversold conditions in an asset. At the moment, it is receding from the overbought zone, suggesting the bullishness is waning.
ETH Price Prediction: The Resistance Block Is Now a Support Block
Ethereum price is trading above the three-year-old resistance block between $3,582 and $3,829. By the looks of it, ETH will mostly likely fall through this block to test the 50% Fibonacci Retracement line marked at $3,582.
If the profit-taking is strong and the second-generation cryptocurrency falls further, a decline to $3,336 is possible. This would mark a 14% drawdown for Ethereum, bringing it back to early March’s price.
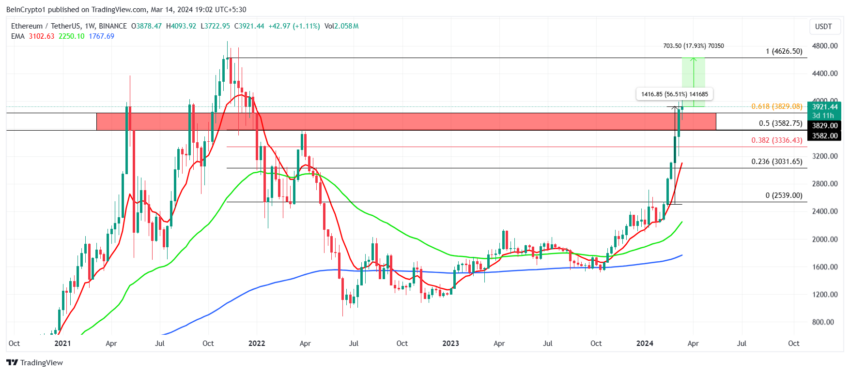
However, since the upper limit of the resistance block coincides with the 61.8% Fibonacci Retracement. This level is also known as the bull run support floor. If ETH sustains above it, it can try another hand at establishing a new all-time high. For the same, it would need to climb by 17.93%, invalidating the bearish thesis.