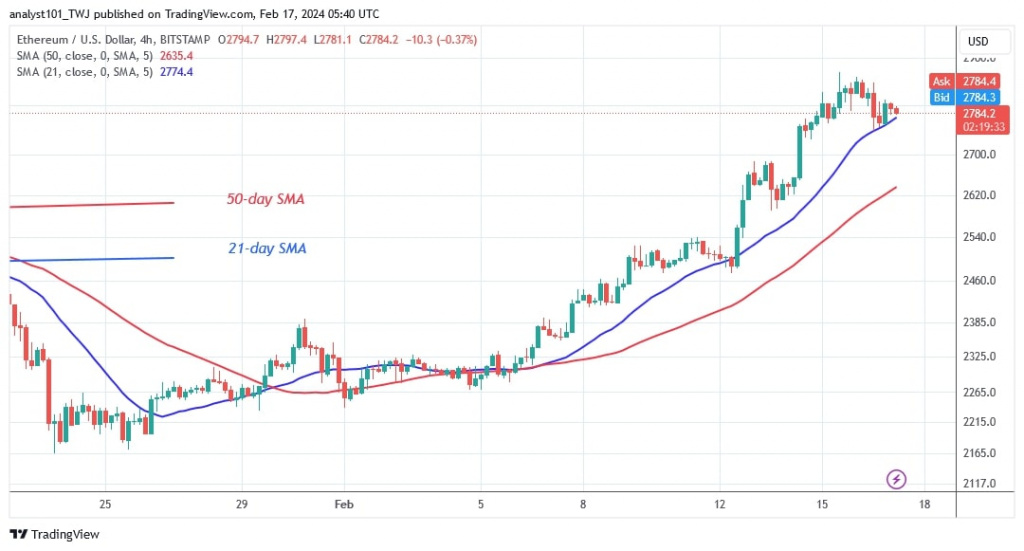
The price of the Ethereum coin is fluctuating below the resistance level of $2,800. Price analysis by Coinidol.com.
Long-term analysis of the Ethereum price: bullish
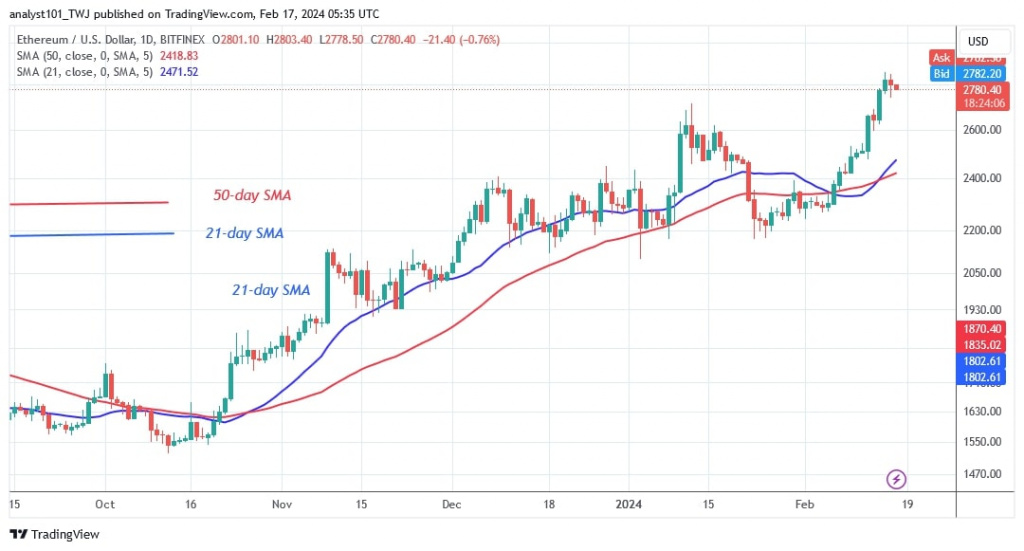
The price of Ethereum (ETH) has surpassed the previous high of $2,715 and reached a high of $2,858 on February 15, 2024. In the last 48 hours, the largest altcoin has experienced a slight decline. The bears are rejecting the digital asset's continued upward trend. The value of the altcoin currently stands at $2,784.
Ether is expected to continue its positive trend as long as it remains above the current support level. Buyers are hoping to push the altcoin to the psychological price threshold of $3,000. Should the bears break through the $2,700 support, the upside scenario would be disrupted. Ether would then fall to its previous low above the 21-day SMA at $2,470.
Analysis of the Ethereum indicators
The moving average lines are leaning north but remain below the price bars. The largest altcoin will continue to rise as long as the price bars remain above the moving average lines. The bullish crossover occurs when the 21-day SMA crosses above the 50-day SMA, indicating bullish order signals for traders.
Technical Indicators:
Key resistance levels – $2,600 and $2,800
Key support levels – $2,400 and $2,200

What is the next direction for Ethereum?
On the upside, Ether is in a gentle uptrend but trading below the $28,000 resistance level. The altcoin has pulled back above the 21-day SMA, suggesting that buyers are trying to resume the bullish momentum.
However, if the bears break below the 21-day SMA, the risks for the altcoin will fall to its previous low. In the meantime, the price of the cryptocurrency remains above the 21-day SMA support.

Disclaimer. This analysis and forecast are the personal opinions of the author and are not a recommendation to buy or sell cryptocurrency and should not be viewed as an endorsement by CoinIdol.com. Readers should do their research before investing in funds.
 coinidol.com
