The Ethereum (ETH) price increased last week and moved above an important long-term Fib resistance level.
Despite the positive long-term movement, ETH was rejected by a short-term Fib resistance level.
Ethereum Closes Above Fib Resistance
The Ethereum price has increased since June 2022. Ethereum created two higher lows (green icons), accelerating its rate of increase after each one.
In November 2023, the Ethereum price broke out from a long-term horizontal resistance level. This led to a high of $2,717 in January 2024, above the 0.382 Fib retracement resistance. After a brief drop, ETH increased above the Fib resistance last week, though it has yet to reach a new yearly high.
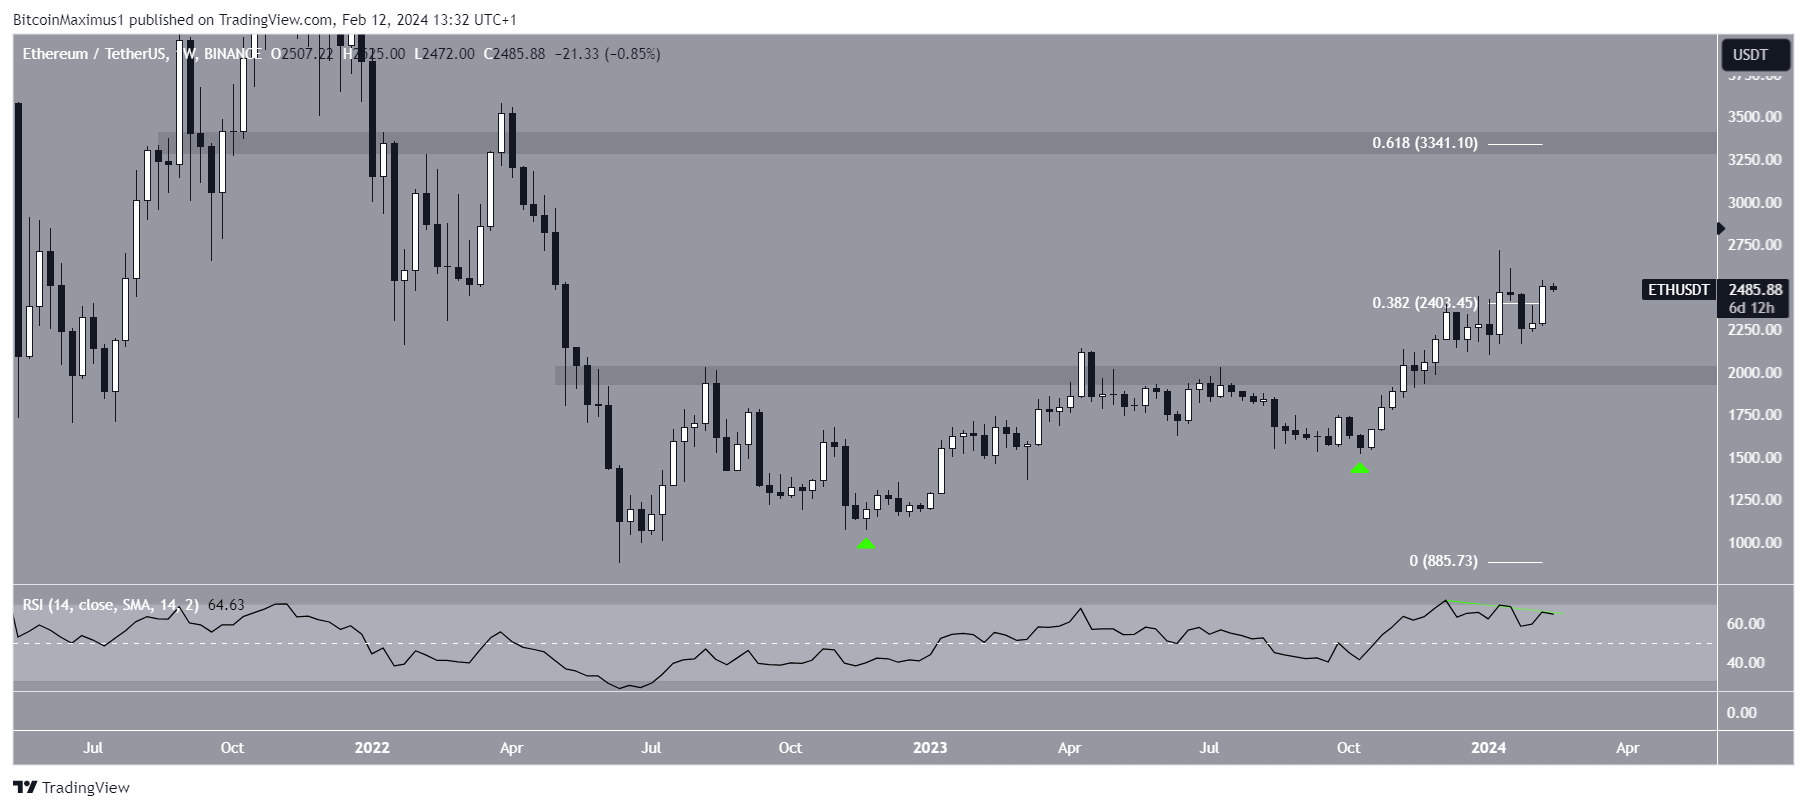
The weekly Relative Strength Index (RSI) gives a mixed reading. Traders utilize the RSI as a momentum indicator to assess whether a market is overbought or oversold and whether to accumulate or sell an asset.
If the RSI reading is above 50 and the trend is upward, bulls still have an advantage, but if the reading is below 50, the opposite is true. While the indicator is falling, it is still above 50. However, it has generated a triple bearish divergence (green) that often precedes downward movements.
What Are Analysts Saying?
Cryptocurrency traders and analysts on X positively view the future Ethereum trend.
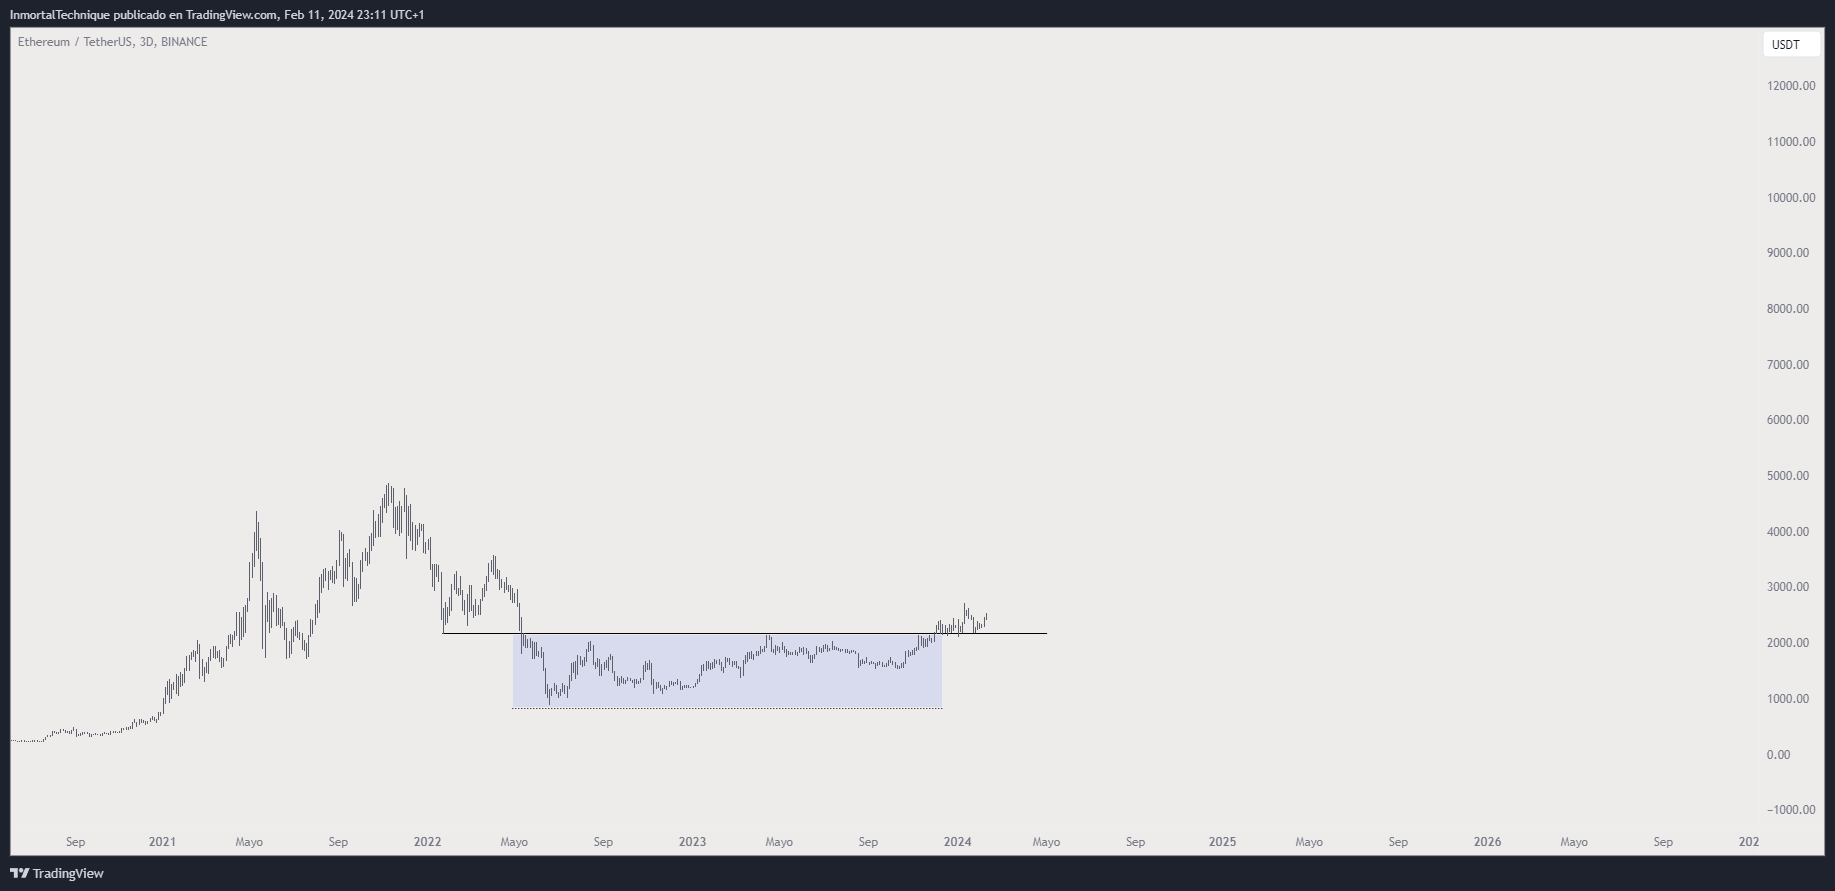
InmortalCrypto believes the bear market accumulation is over.
OnChainDataNerd noted a worrisome development since Ethereum’s co-founder is apparently selling some of his holdings.
15 hours ago, #Ethereum co-founder Jeffrey Wilcke (@jeffehh ) deposited 4,300 $ETH ($10.7M) to #Kraken at $2482. Notably, he last deposited 22K $ETH ($41.1M) to #Kraken at $1870 on June 5, 2023, just before the market crashed. His current balance is 146K $ETH ($362M), OnChainDataNerd stated.
CryptoAnup also believes the long-term trend is bullish. He suggests the price will increase above $10,000 in the upcoming bull run. Finally, MTI_Trading notes the recent short-term breakout, predicting that this is the catalyst to $3,000.
ETH Price Prediction: $2,000 or $3,000 First?
Similarly to the weekly chart, the daily one does not confirm the trend’s direction.
While the chart shows that the ETH price broke out from a descending resistance trend line, the 0.618 Fib retracement resistance level rejected the price at $2,510 (red icon). The 0.618 Fib resistance often determines whether an increase is corrective or not.
Despite the rejection, the daily RSI is increasing above 50, a sign the trend is bullish. So, if ETH breaks out from the 0.618 Fib retracement level, it will be expected to reach a new yearly high. Due to the lack of overhead resistance, the price can increase 35% to the long-term 0.618 Fib retracement resistance level (white) at $3,350.
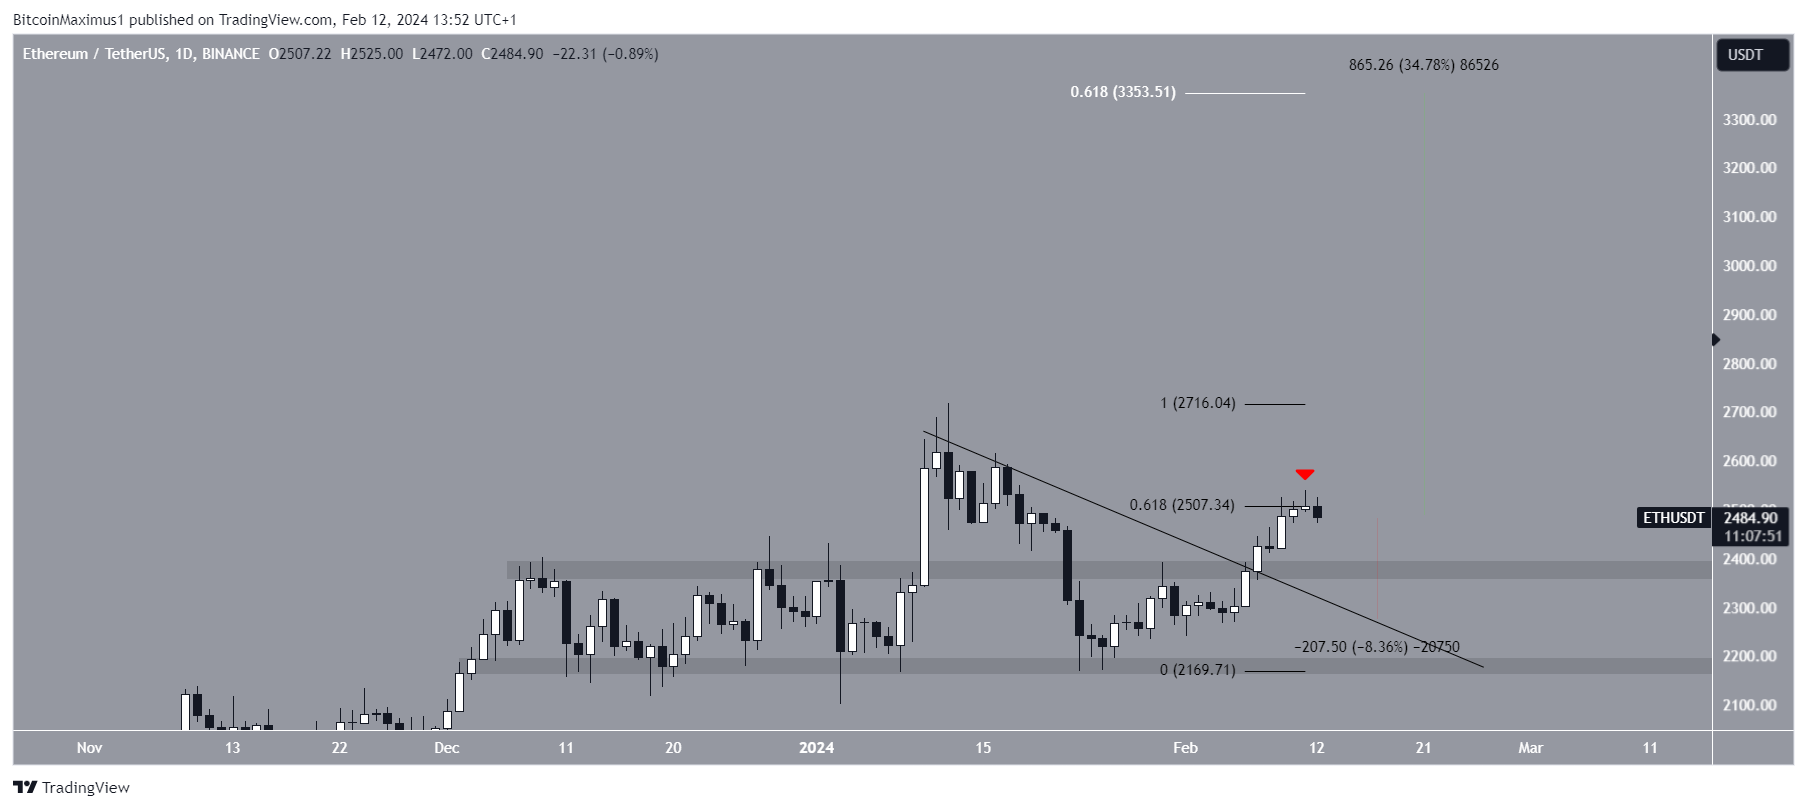
Despite the bullish ETH price prediction, a close below the minor support at $2,380 will put the upward movement at risk. Then, ETH can fall 8% to the descending resistance trend line at $2,300.
For BeInCrypto‘s latest crypto market analysis, click here.
Disclaimer
In line with the Trust Project guidelines, this price analysis article is for informational purposes only and should not be considered financial or investment advice. BeInCrypto is committed to accurate, unbiased reporting, but market conditions are subject to change without notice. Always conduct your own research and consult with a professional before making any financial decisions. Please note that our Terms and Conditions, Privacy Policy, and Disclaimers have been updated.