The Ethereum (ETH) price began an upward movement on November 17 and is approaching its yearly high.
Despite several attempts, ETH has yet to reach a new yearly high since April 16. Will it finally do so?
Ethereum Nearly Reaches Yearly High
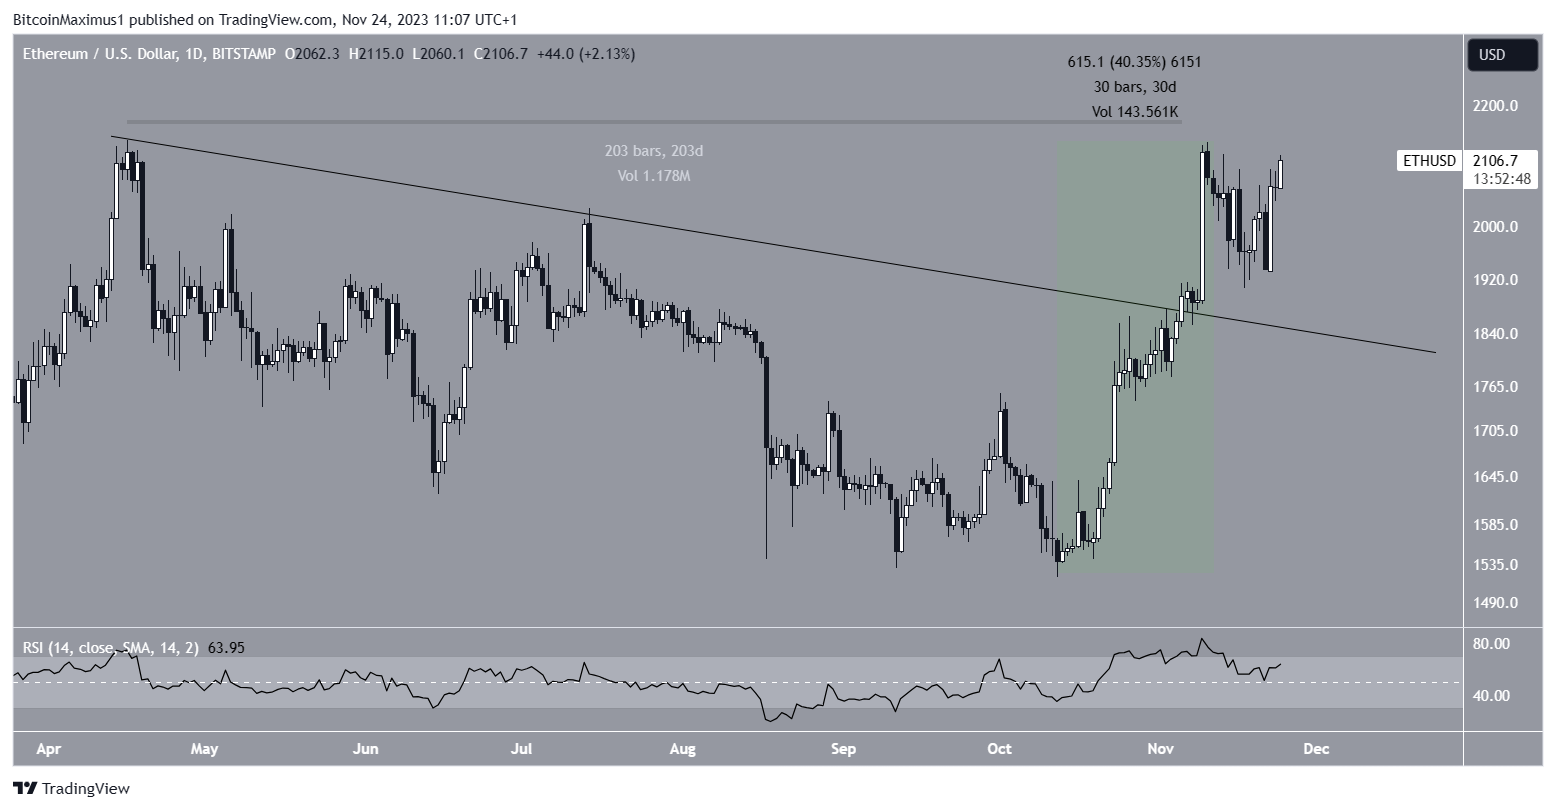
The technical analysis of the daily time frame shows that the ETH price has increased rapidly since the start of October. During this time, it broke out from a descending resistance trendline that had been in place for 203 days, since the yearly high on April 16.
The upward movement culminated with a high of $2,136 on November 10, an increase of 30% since the October lows.
The ETH price fell afterward but regained its footing on November 17.
Market traders use the RSI as a momentum indicator to identify overbought or oversold conditions and to decide whether to accumulate or sell an asset.
Readings above 50 and an upward trend indicate that bulls still have an advantage, whereas readings below 50 suggest the opposite.
While the daily RSI is decreasing, it is still above 50.
What Are the Analysts Saying?
Cryptocurrency traders and analysts on X have a bullish outlook for the future Ethereum price.
Big Cheds noted the ongoing breakout, stating that the price will continue increasing toward the yearly high.
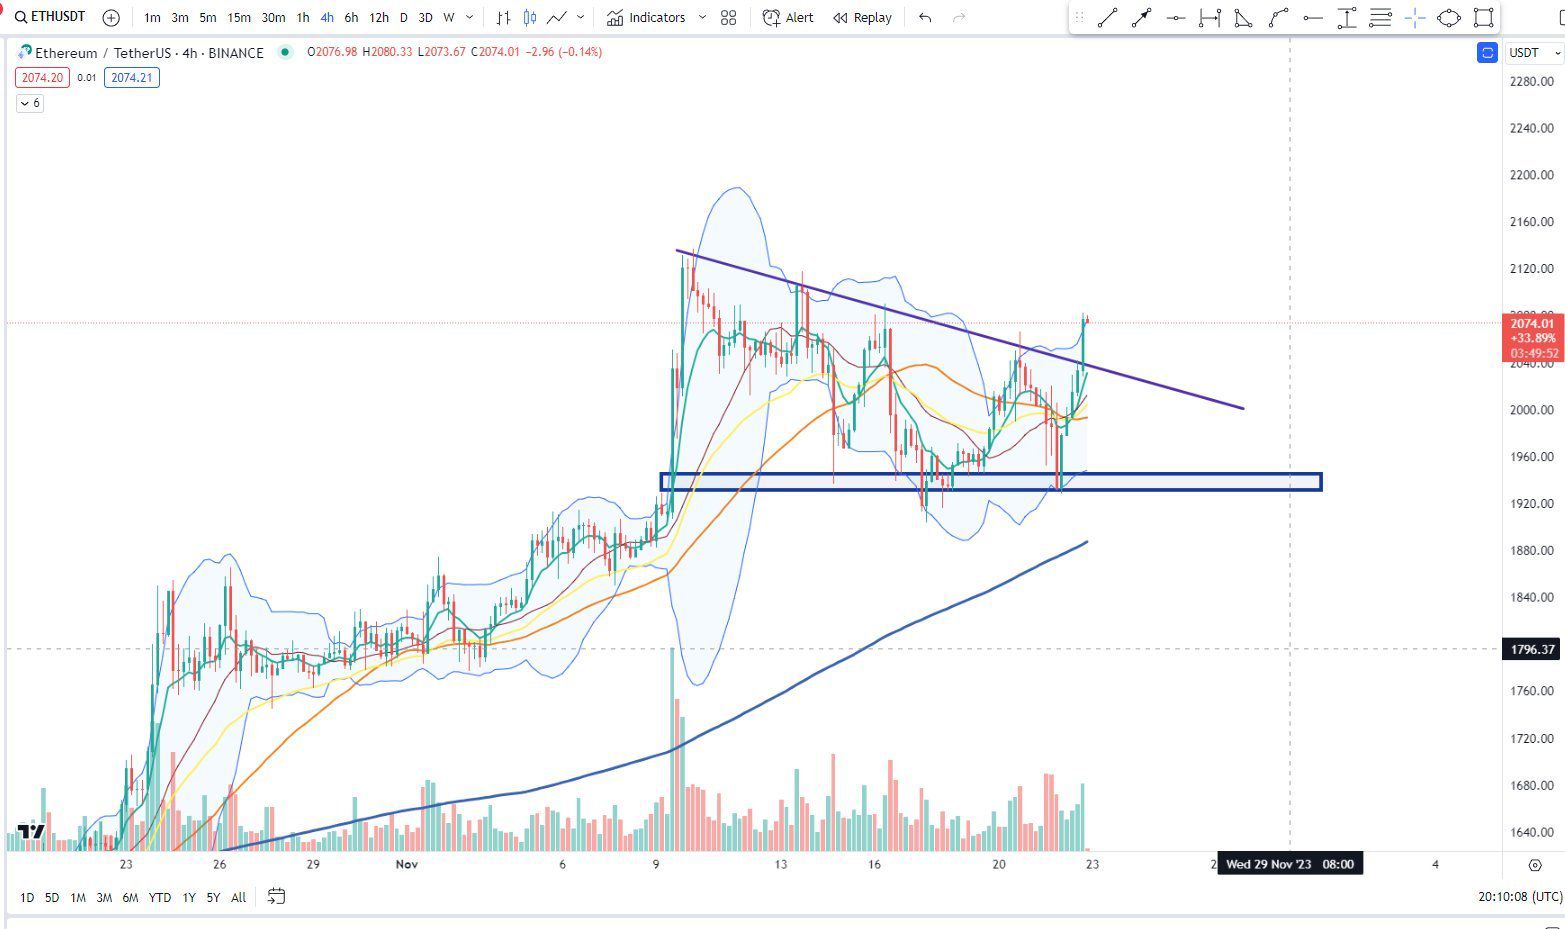
Crypto Scient is similarly bullish because the price has flipped a critical resistance area. He stated that:
Perfect S/R flip at $2045 There can’t be a more textbook play. A perfect S/R flip yesterday and we are pushing higher. For LTF Continuation, $2045 was a key 4H level, We flipped it and the price is now moving towards local highs. I would really expect the price to break the highs and start moving towards the $2300 level. On HTF, $1930 remains a key level. As long as we are above it, I am bullish.
However, XForceGlobal is not as convinced that the trend is bullish, at least in the short term. He used Elliot Wave Theory to determine that the price will complete one more low before eventually resuming its increase.
Technical analysts employ the Elliott Wave theory to identify recurring long-term price patterns and investor psychology, which helps them determine the direction of a trend.
ETH Price Prediction: How Long Until New Yearly High?
A closer look at the daily timeframe movement gives a bullish reading because of the wave count and the RSI.
The wave count suggests that the ETH price has completed a five-wave upward movement and the ensuing A-B-C correction.
If the count is correct, the ETH price can increase by another 20% to the next resistance at $2,530. The 1.61 external Fib retracement of the most recent drop creates the resistance.
The RSI has generated hidden bullish divergence (green), a strong sign of trend continuation, aligning with the bullish count.
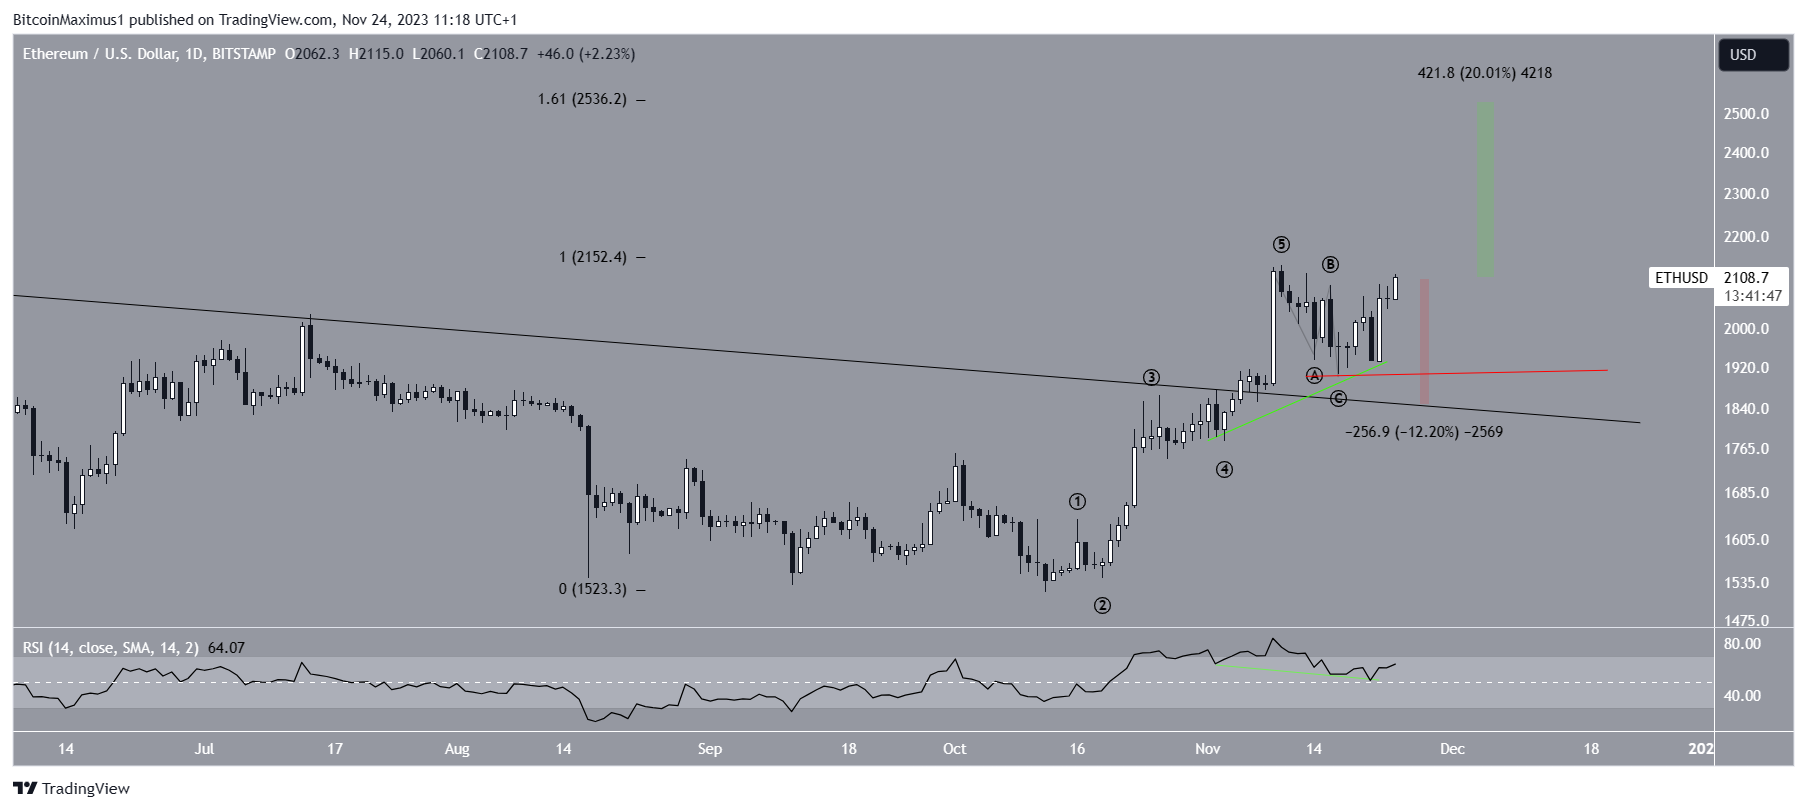
Despite this bullish ETH price prediction, a decrease below the wave C low of $1,906 (red line) will invalidate the bullish count. In that case, the ETH price can fall and validate the resistance trend line at $1,840.
For BeInCrypto‘s latest crypto market analysis, click here.