The number of investors holding 1+ Ethereum (ETH) has dropped to a 3-month low. According to an X post shared by the on-chain analytics platform, Glassnode Alerts, the number of addresses holding 1+ ETH has dropped to 1,743,744. The X post also shared that the previous 3-month low was reached on 23 September 2023, and stood at 1,743,795 addresses.
📉 #Ethereum $ETH Number of Addresses Holding 1+ Coins just reached a 3-month low of 1,743,744
— glassnode alerts (@glassnodealerts) September 24, 2023
Previous 3-month low of 1,743,795 was observed on 23 September 2023
View metric:https://t.co/IuKpD48IXd pic.twitter.com/JjYRNd80nd
Despite this drop in the number of ETH addresses holding 1+ coins, the altcoin leader continued to trade in a positive trend. However, a significant bearish technical flag may be triggered in the coming 48 hours which could lead to ETH entering into a bearish trend reversal.
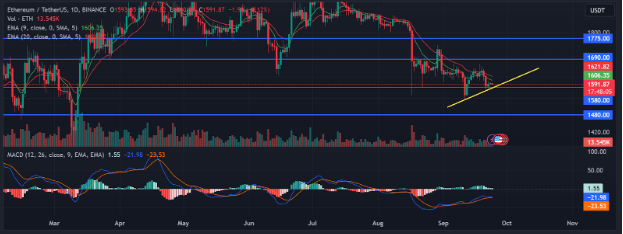
At press time, ETH’s price was hovering above the key support level at $1,580. Furthermore, it continued to trade below the 9-day and 20-day EMA lines after it had fallen below the 2 technical indicators on 20 September 2023.
If ETH breaks below the $1,580 support level in the upcoming few days, then the cryptocurrency may be at risk of falling to the next crucial support level at $1,480. This will also result in ETH’s price breaking below a positive trend line that had formed on its daily chart after it recorded 2 higher lows.
On the other hand, if the $1,580 support level is able to hold for the next 72 hours, then ETH’s price may attempt to reclaim a position above the 9-day and 20-day EMA lines. Should the cryptocurrency succeed in breaking above these 2 technical indicators, then it may have the foundation needed to overcome the next resistance level at $1,690 as well.
Continued buy pressure could result in ETH flipping the $1,690 resistance level into support. Subsequently, the altcoin’s price may continue to rise to $1,775 throughout the course of the following week.
Technical indicators suggested that a bearish scenario was more likely to play out in the coming week. Firstly, the 9-day EMA line was positioned below the 20-day EMA line, which indicated that momentum over the past 9 days was more bearish than the momentum during the past 20 days.
Secondly, a noteworthy bearish technical flag was on the verge of being triggered on ETH’s daily chart. At press time, the daily MACD line was looking to cross below the daily MACD Signal line. If these 2 lines cross, it will suggest a continuation in ETH’s bearish short-term momentum.
Disclaimer: The views and opinions, as well as all the information shared in this price analysis, are published in good faith. Readers must do their own research and due diligence. Any action taken by the reader is strictly at their own risk. Coin Edition and its affiliates will not be held liable for any direct or indirect damage or loss.