The price action is limited to the upside, ETH/USD is moving within a bearish flag structure via the daily chart.
ETH/USD Market
Key Levels:
Supply levels: $200, $210, $220
Demand levels: $155, $145, $135
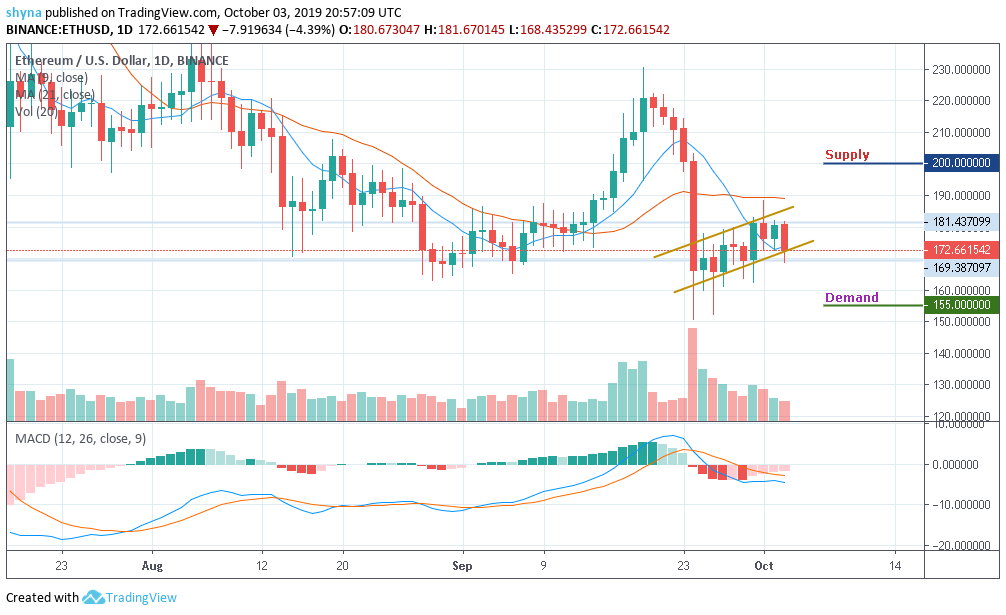
ETH/USD is range-bound during Thursday trading. The second-largest digital coin with the current market value of $18.7 billion has been trading in a downward trend since the beginning of the day amid vanishing volatility and low trading volumes. For now, ETH/USD is changing hands at $172.6 and trading within the moving averages of 9-day and 21-day with no clear short-term direction.
Looking at the daily chart, ETH/USD is initially supported by $168 and it is closely followed by $160. Once these demand levels are cleared, the sell-off is likely to gain traction with the next focus on $155, $145 and $135 demand levels. On the upside, the local supply is created by a psychological $180 and followed by the recent high of $190. This supply level is likely to limit the recovery for the time being. However, once this is eliminated, the momentum should accelerate with the next focus at $200, $220 and $240 supply levels.
Meanwhile, the signal lines of the MACD indicator are crossing into the negative zone, indicating bearish signals.
ETH/BTC Market
Since September 7, 2019, ETH/BTC has continued to follow a bullish trend and now, the price may likely test the 0.022 BTC level in the nearest week. Last two months, the coin suffered from a strong selling power before the bulls stepped back into the market; since then, the buyers continue to release huge pressure on the market till now.
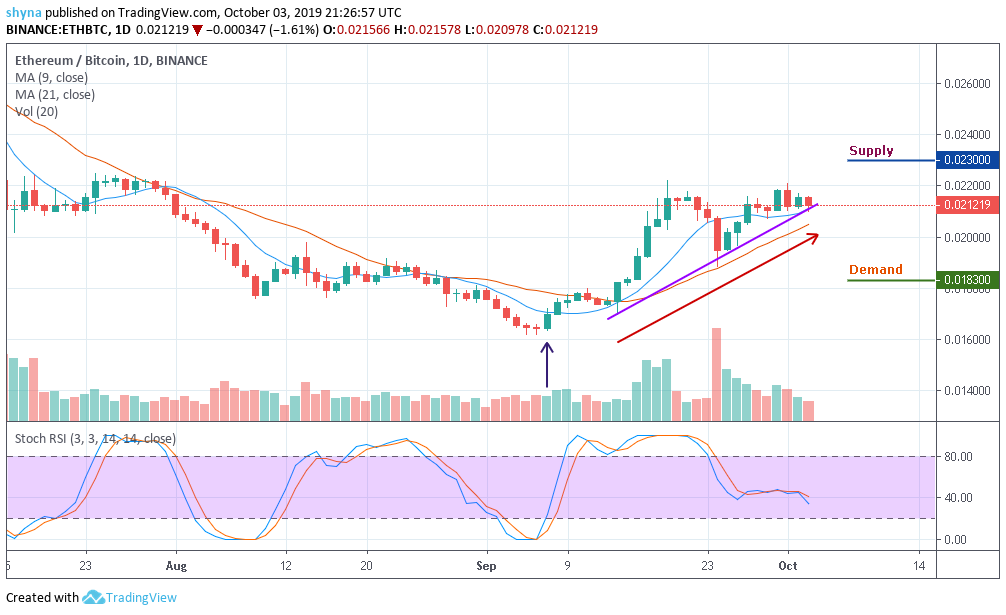
Currently, Ethereum is trading around 0.0.212 BTC which is very close to the critical supply level. Should the buyer put more effort, the price could hit the supply levels of 0.023 BTC and 0.024 BTC respectively. In other words, the bearish scenario might rally and the price could slip to 0.0183 BTC and 0.0180 BTC demand levels. Currently, the stochastic RSI indicator is moving at level 40 as there is a high probability for the coin to break or bounce.
Please note: Cryptovibes.com is not a financial advisor. Do your research before investing your funds in any financial asset or presented product or event. We are not responsible for your investing results.