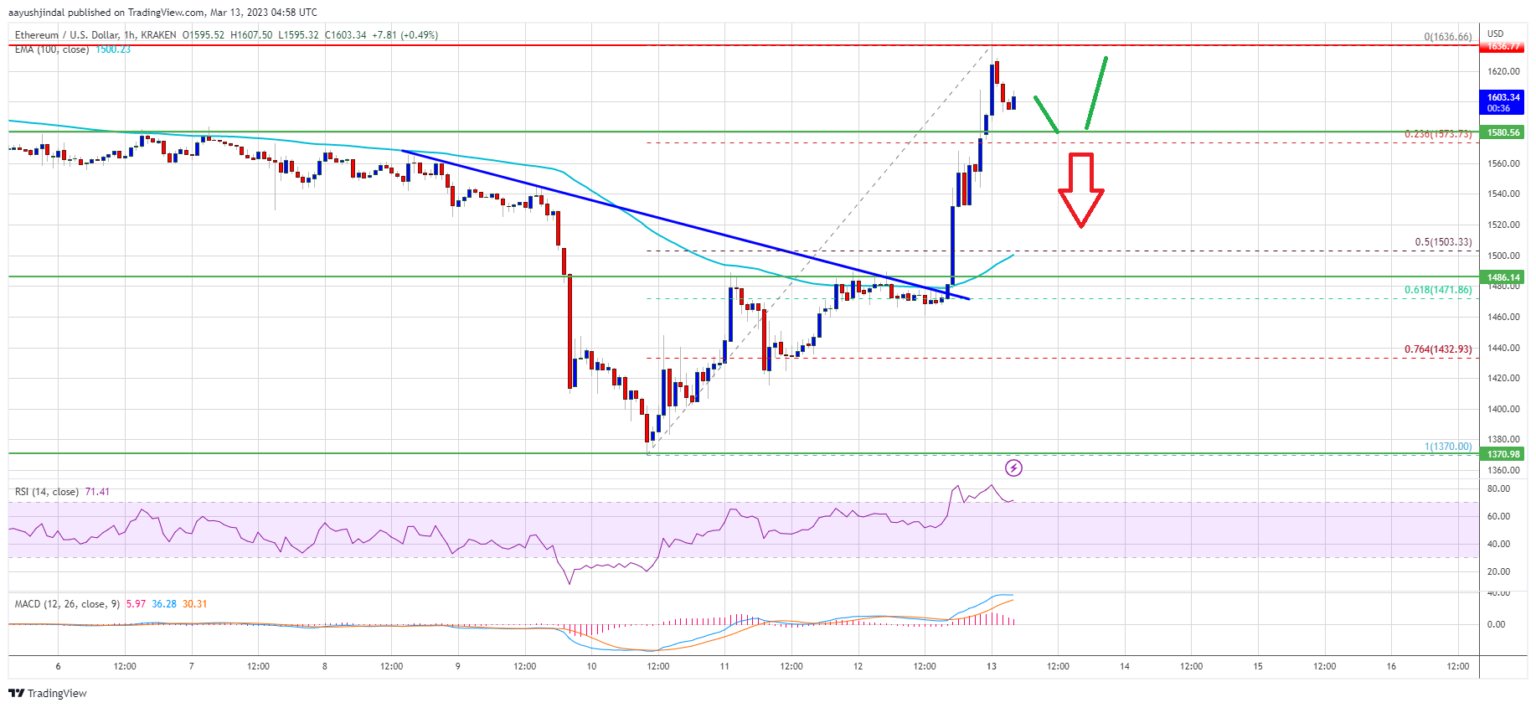
Ethereum price rallied over 10% and broke the $1,600 resistance against the US Dollar. ETH could continue to rise if it stays above the $1,580 support zone.
- Ethereum started a major increase above the $1,565 resistance zone.
- The price is trading above $1,580 and the 100 hourly simple moving average.
- There was a break above a crucial bearish trend line with resistance near $1,480 on the hourly chart of ETH/USD (data feed via Kraken).
- The pair could correct lower, but dips might be limited below the $1,580 support.
Ethereum Price Surges Over 10%
Ethereum price spiked towards the $1,370, where the bulls took a stand. ETH formed a base and started a strong increase above the $1,450 resistance, similar to bitcoin.
There was a clear move above the $1,500 and $1,565 resistance levels. Besides, there was a break above a crucial bearish trend line with resistance near $1,480 on the hourly chart of ETH/USD. Finally, the pair surpassed the $1,600 resistance and traded as high as $1,636.
Ether price is now trading above $1,580 and the 100 hourly simple moving average. It is consolidating gains and trading above the 23.6% Fib retracement level of the upward move from the $1,370 swing low to $1,636 high.
On the upside, the price is facing resistance near the $1,630 zone. The first major resistance is near the $1,680 zone. The next major resistance is near the $1,700 level.
Source: ETHUSD on TradingView.com
The main resistance is still near the $1,740 zone. A close above the $1,740 resistance zone might start a major uptrend. In this case, the price may perhaps rise towards the $1,850 resistance level.
Dips Limited in ETH?
If ethereum fails to clear the $1,630 resistance, it could start a downside correction. An initial support on the downside is near the $1,580 level.
The next major support is near the $1,560 zone. If there is a break below $1,560, the price might drop towards $1,500. It is near the 50% Fib retracement level of the upward move from the $1,370 swing low to $1,636 high. Any more losses might call for a test of the $1,430 level.
Technical Indicators
Hourly MACD – The MACD for ETH/USD is now losing momentum in the bullish zone.
Hourly RSI – The RSI for ETH/USD is now in the overbought zone.
Major Support Level – $1,580
Major Resistance Level – $1,630