Ethereum has seen a strong week of price performance after increasing by 9%, to reach a current price of around $182 – Bitfinex rate. The cryptocurrency now has to contend with resistance around the $185 area to be free to make an attempt at $200.
Ethereum has now seen a strong 90-day performance where the coin has risen by 62%. The cryptocurrency is now ranked in 2nd place amongst the top coins by market cap value as it currently holds an $18.48 billion market cap.
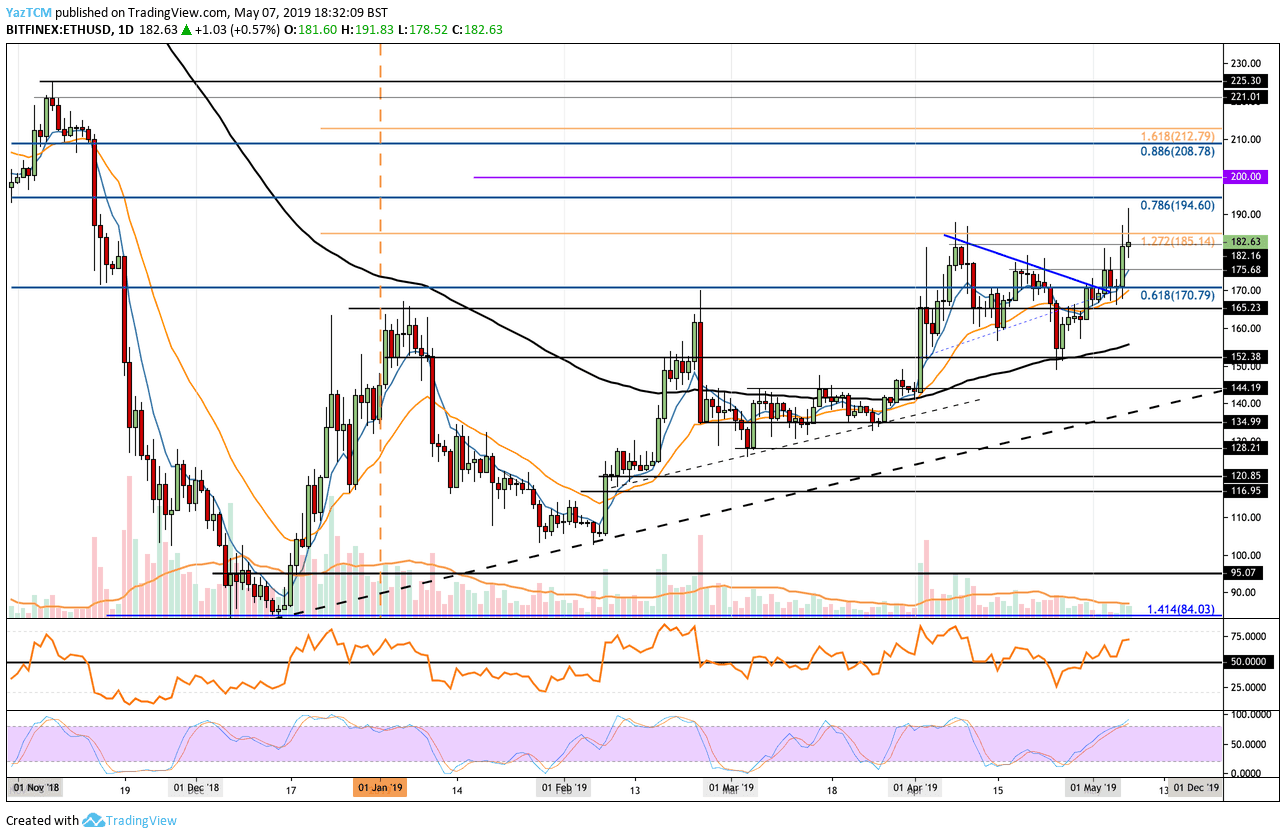
Looking at the ETH/USD 1-Day Chart:
- Since our previous ETH/USD analysis, we can see that the coin has continued to break above the resistance at the short term descending trend line and has continued higher since. Ethereum has reached a high of $191 in today’s trading session but still struggles to remain above the $185 resistance level.
- From above: The next level of significant resistance for the coin to close above lies at $185 which contains a 1.272 Fibonacci Extension level. The coin had failed to close above this level during April 2019 so significant momentum will be required to break above. Above $185, higher resistance lies at $194 and $200. If the buyers continue above $200, further resistance lies at $208 and $212.
- From below: Initial support now lies at $180 and $175. Beneath $175, further support lies at $170, $165 and $160.
- The Stochastic RSI has recently gone through a crossover in the overbought territory which could suggest that a retracement is possible. However, the RSI remains above the 50 level as the bulls remain in control of the momentum.
- The trading volume had increased over the last 2 – 3 days as the
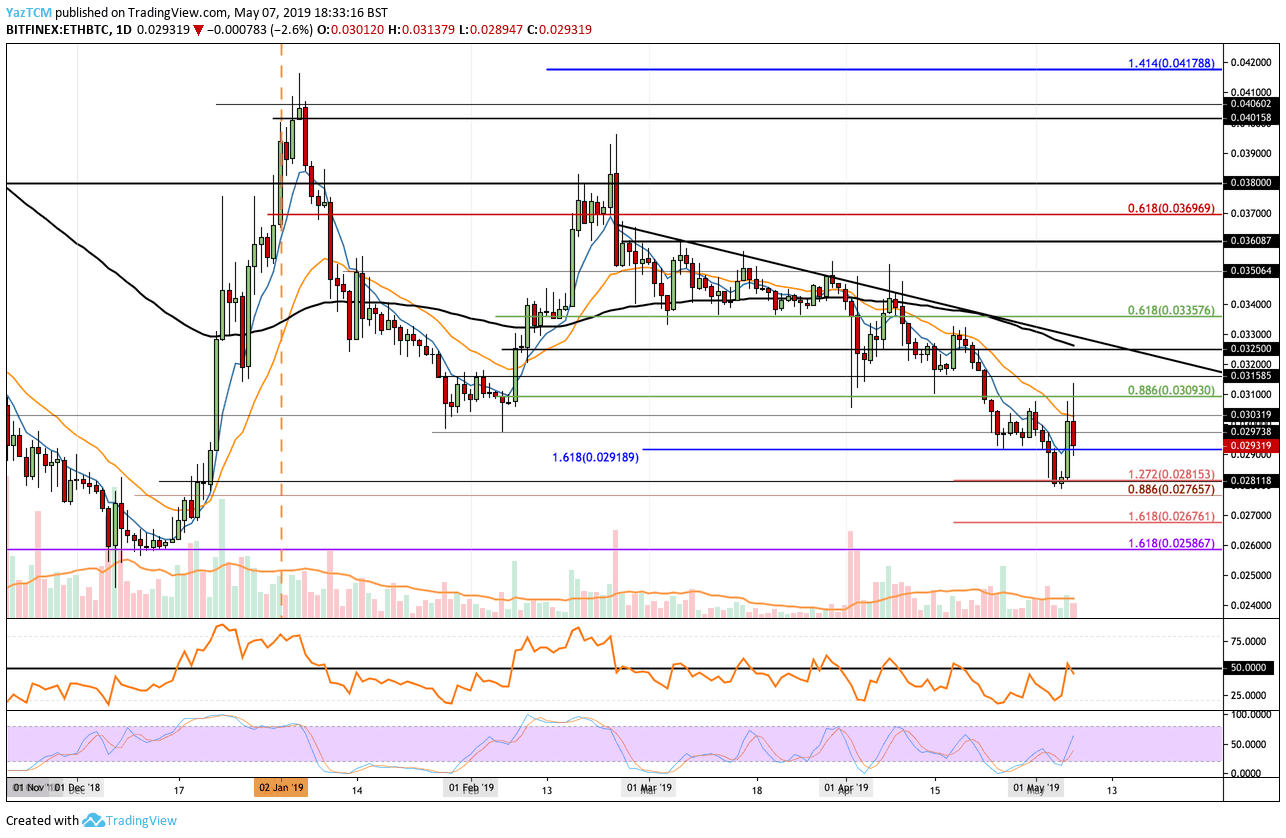
Looking at the ETH/BTC 1-Day Chart:
- Following our previous ETH/BTC analysis, we can see that Ethereum had continued to lose value against BTC as the coin broke beneath the support at 0.029 BTC toward the further support at 0.02815 BTC. This level is maintained by a short term downside 1.272 Fibonacci Extension level. ETH/BTC has rebounded from this low and now trades close to 0.03 BTC
- From above: The nearest level of resistance now lies at 0.03 BTC. If the bulls break above 0.03 BTC, further resistance then lies at 0.031 BTC, 0.0325 BTC (which also contains the 100 days moving average line) and 0.033 BTC.
- From below: The nearest level of support now lies at 0.02918 BTC. Beneath this, further support lies at 0.02765 BTC, 0.02675 BTC and 0.02586 BTC which is the December 2018 low.
- The RSI has recently struggled to break above the 50 level after making an attempt to do. If the RSI cannot break above the 50 level, we can continue to expect ETH/BTC to drop.