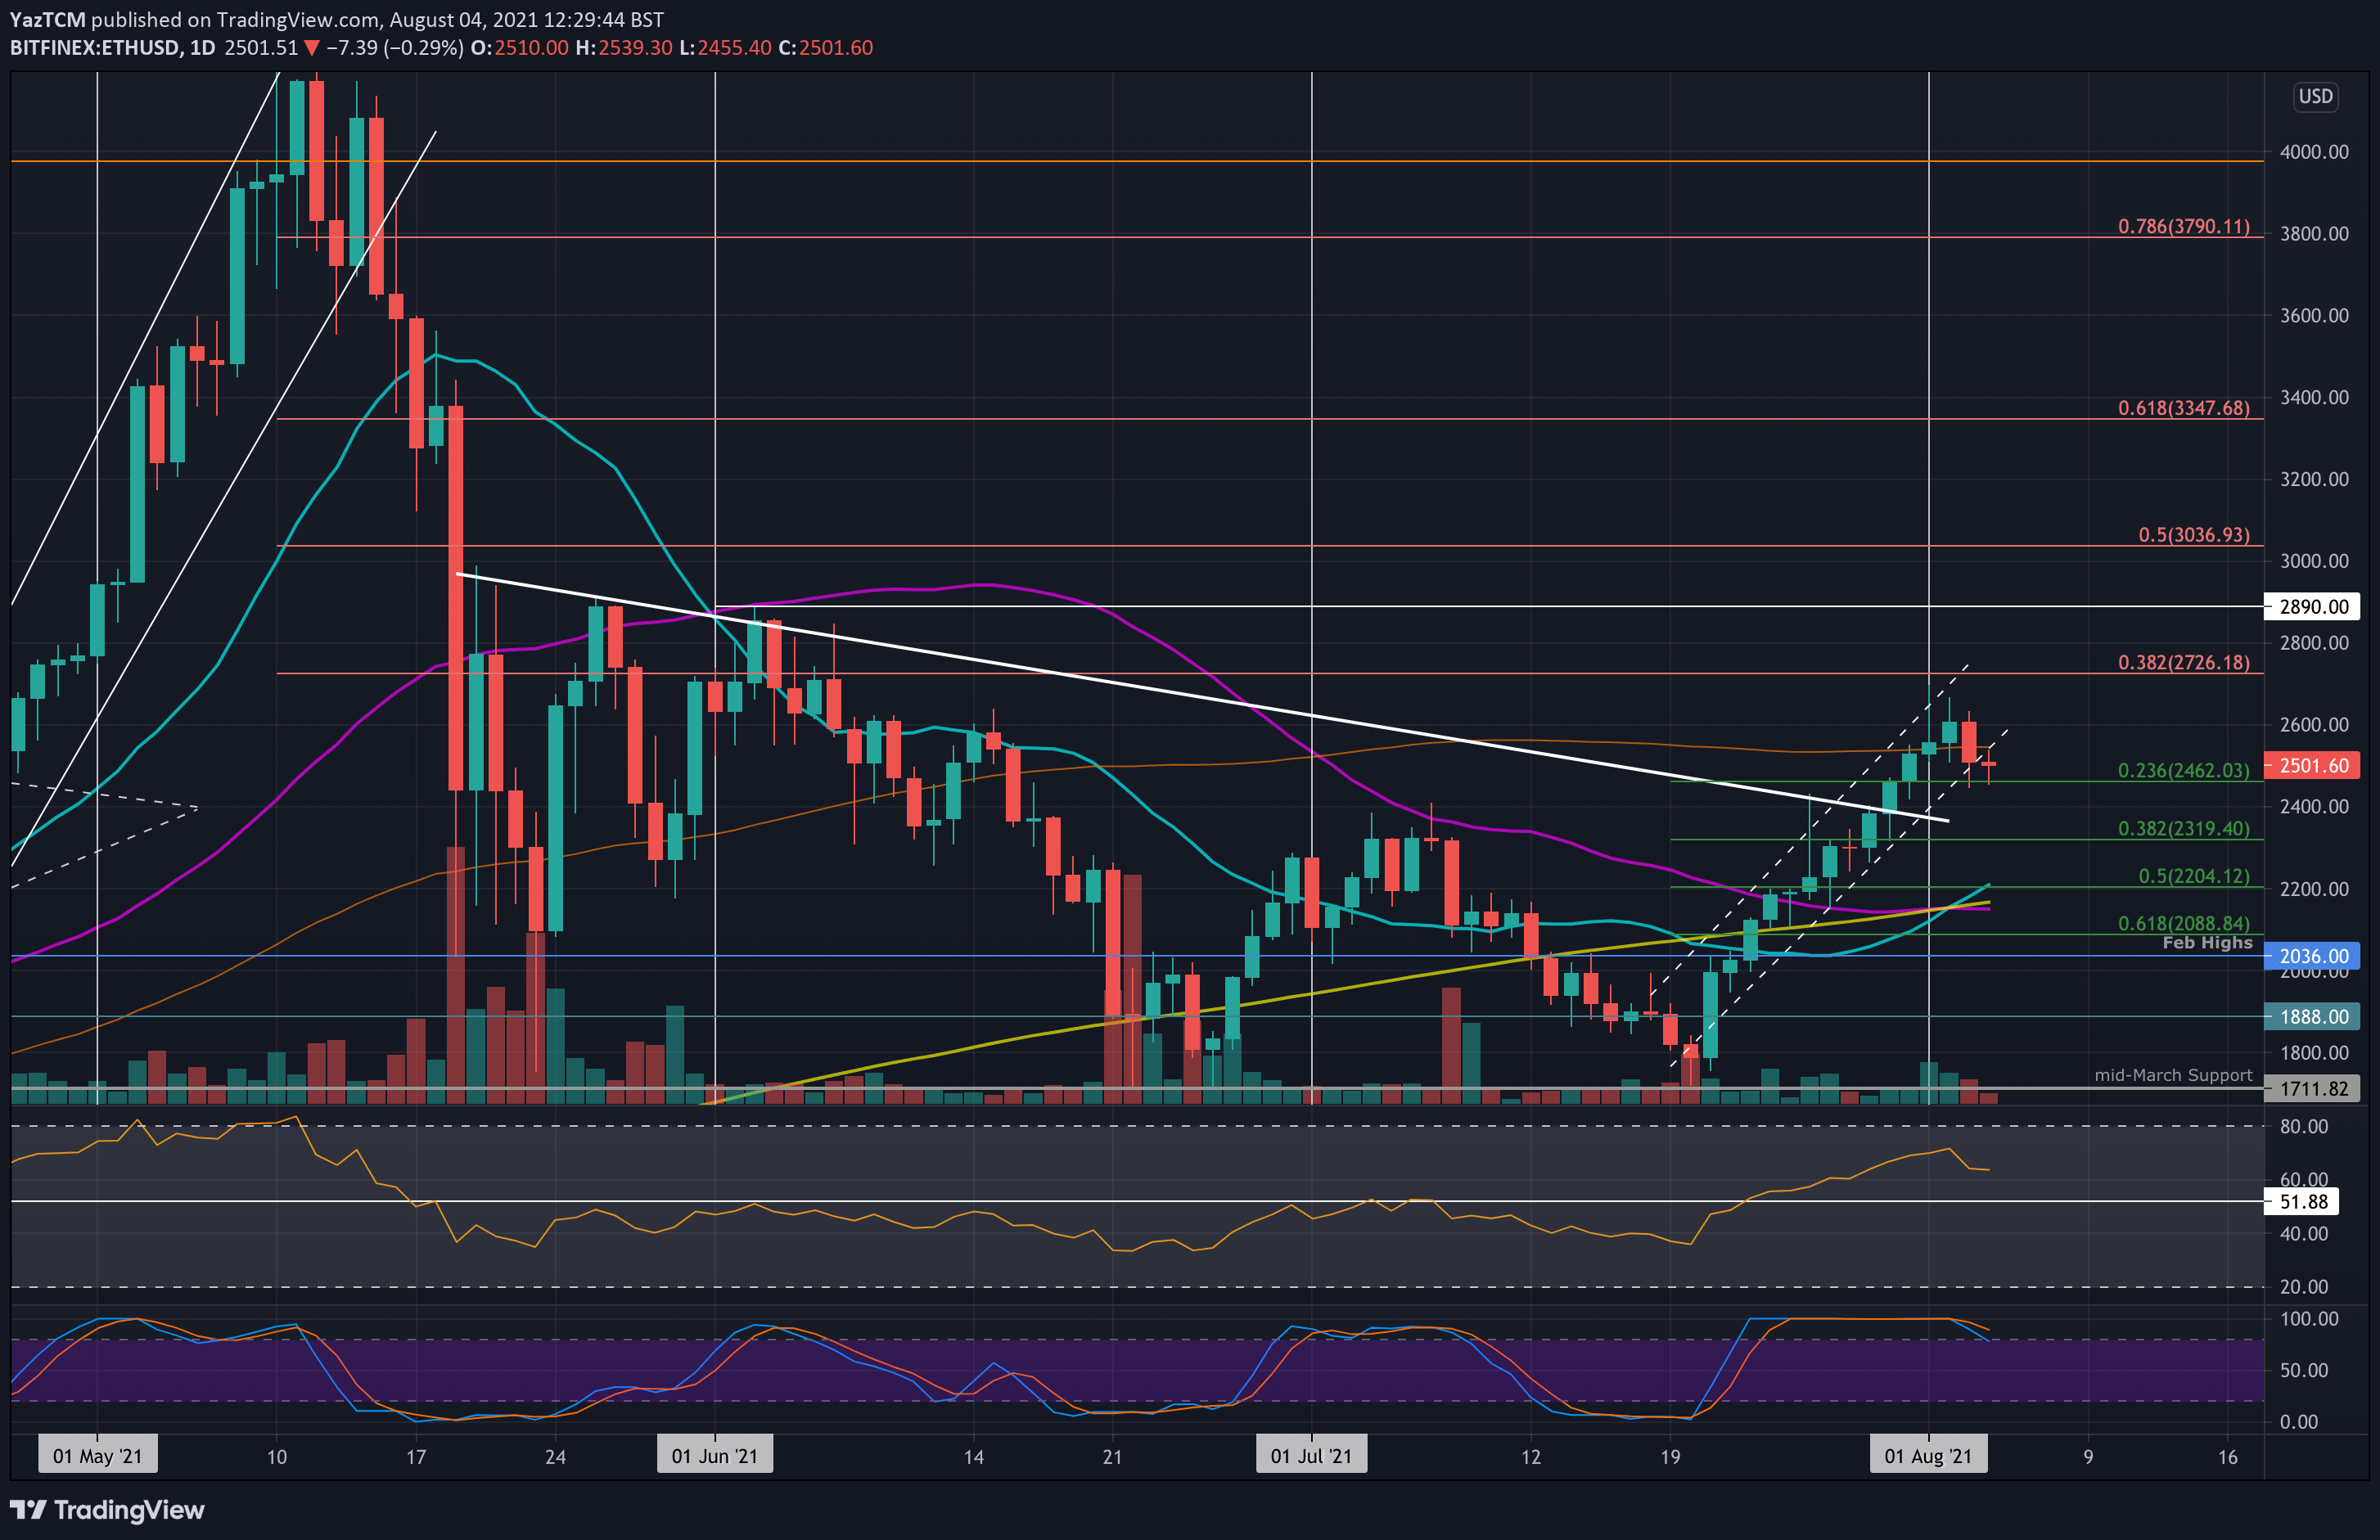
ETH/USD – Ether Falls Below Price Chanel But Finds .236 Fib Support
Key Support Levels: $2460, $2400, $2320.
Key Resistance Levels: $2550, $2640, $2700.
Ethereum surged higher over the past fortnight inside the confines of an ascending price channel. This price channel allowed it to reach as high as $2700 this week. Unfortunately, ETH pulled back slightly from this high and fell beneath the price channel today.
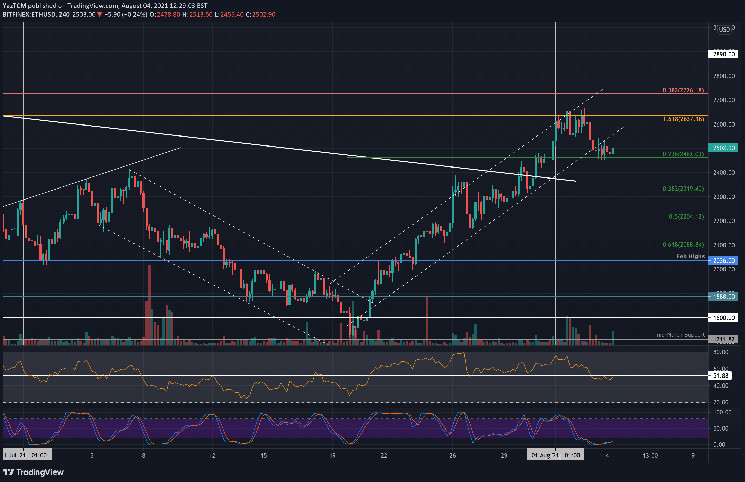
After breaking the lower angle of the price channel and the 100-day MA, ETH slipped until support was found at $2460, provided by a .236 Fib Retracement level. The break beneath the price channel and the subsequent support is best seen on the 4-hour chart.
ETH-USD Short Term Price Prediction
Looking ahead, the first resistance now lies at $2550 (100-day MA). This is followed by $2640 (1.618 Fib Extension), $2700, and $2890
On the other side, the first support lies at $2460 (.236 Fib). This is followed by $2400, $2320 (.382 Fib), and $2200 (.5 Fib & 20-day MA).
The daily RSI remains in the bullish favor, although it is pointing lower, which hints at fading bullish momentum. However, the 4-our RSI is neutral as the buyers battle to regain short-term momentum.
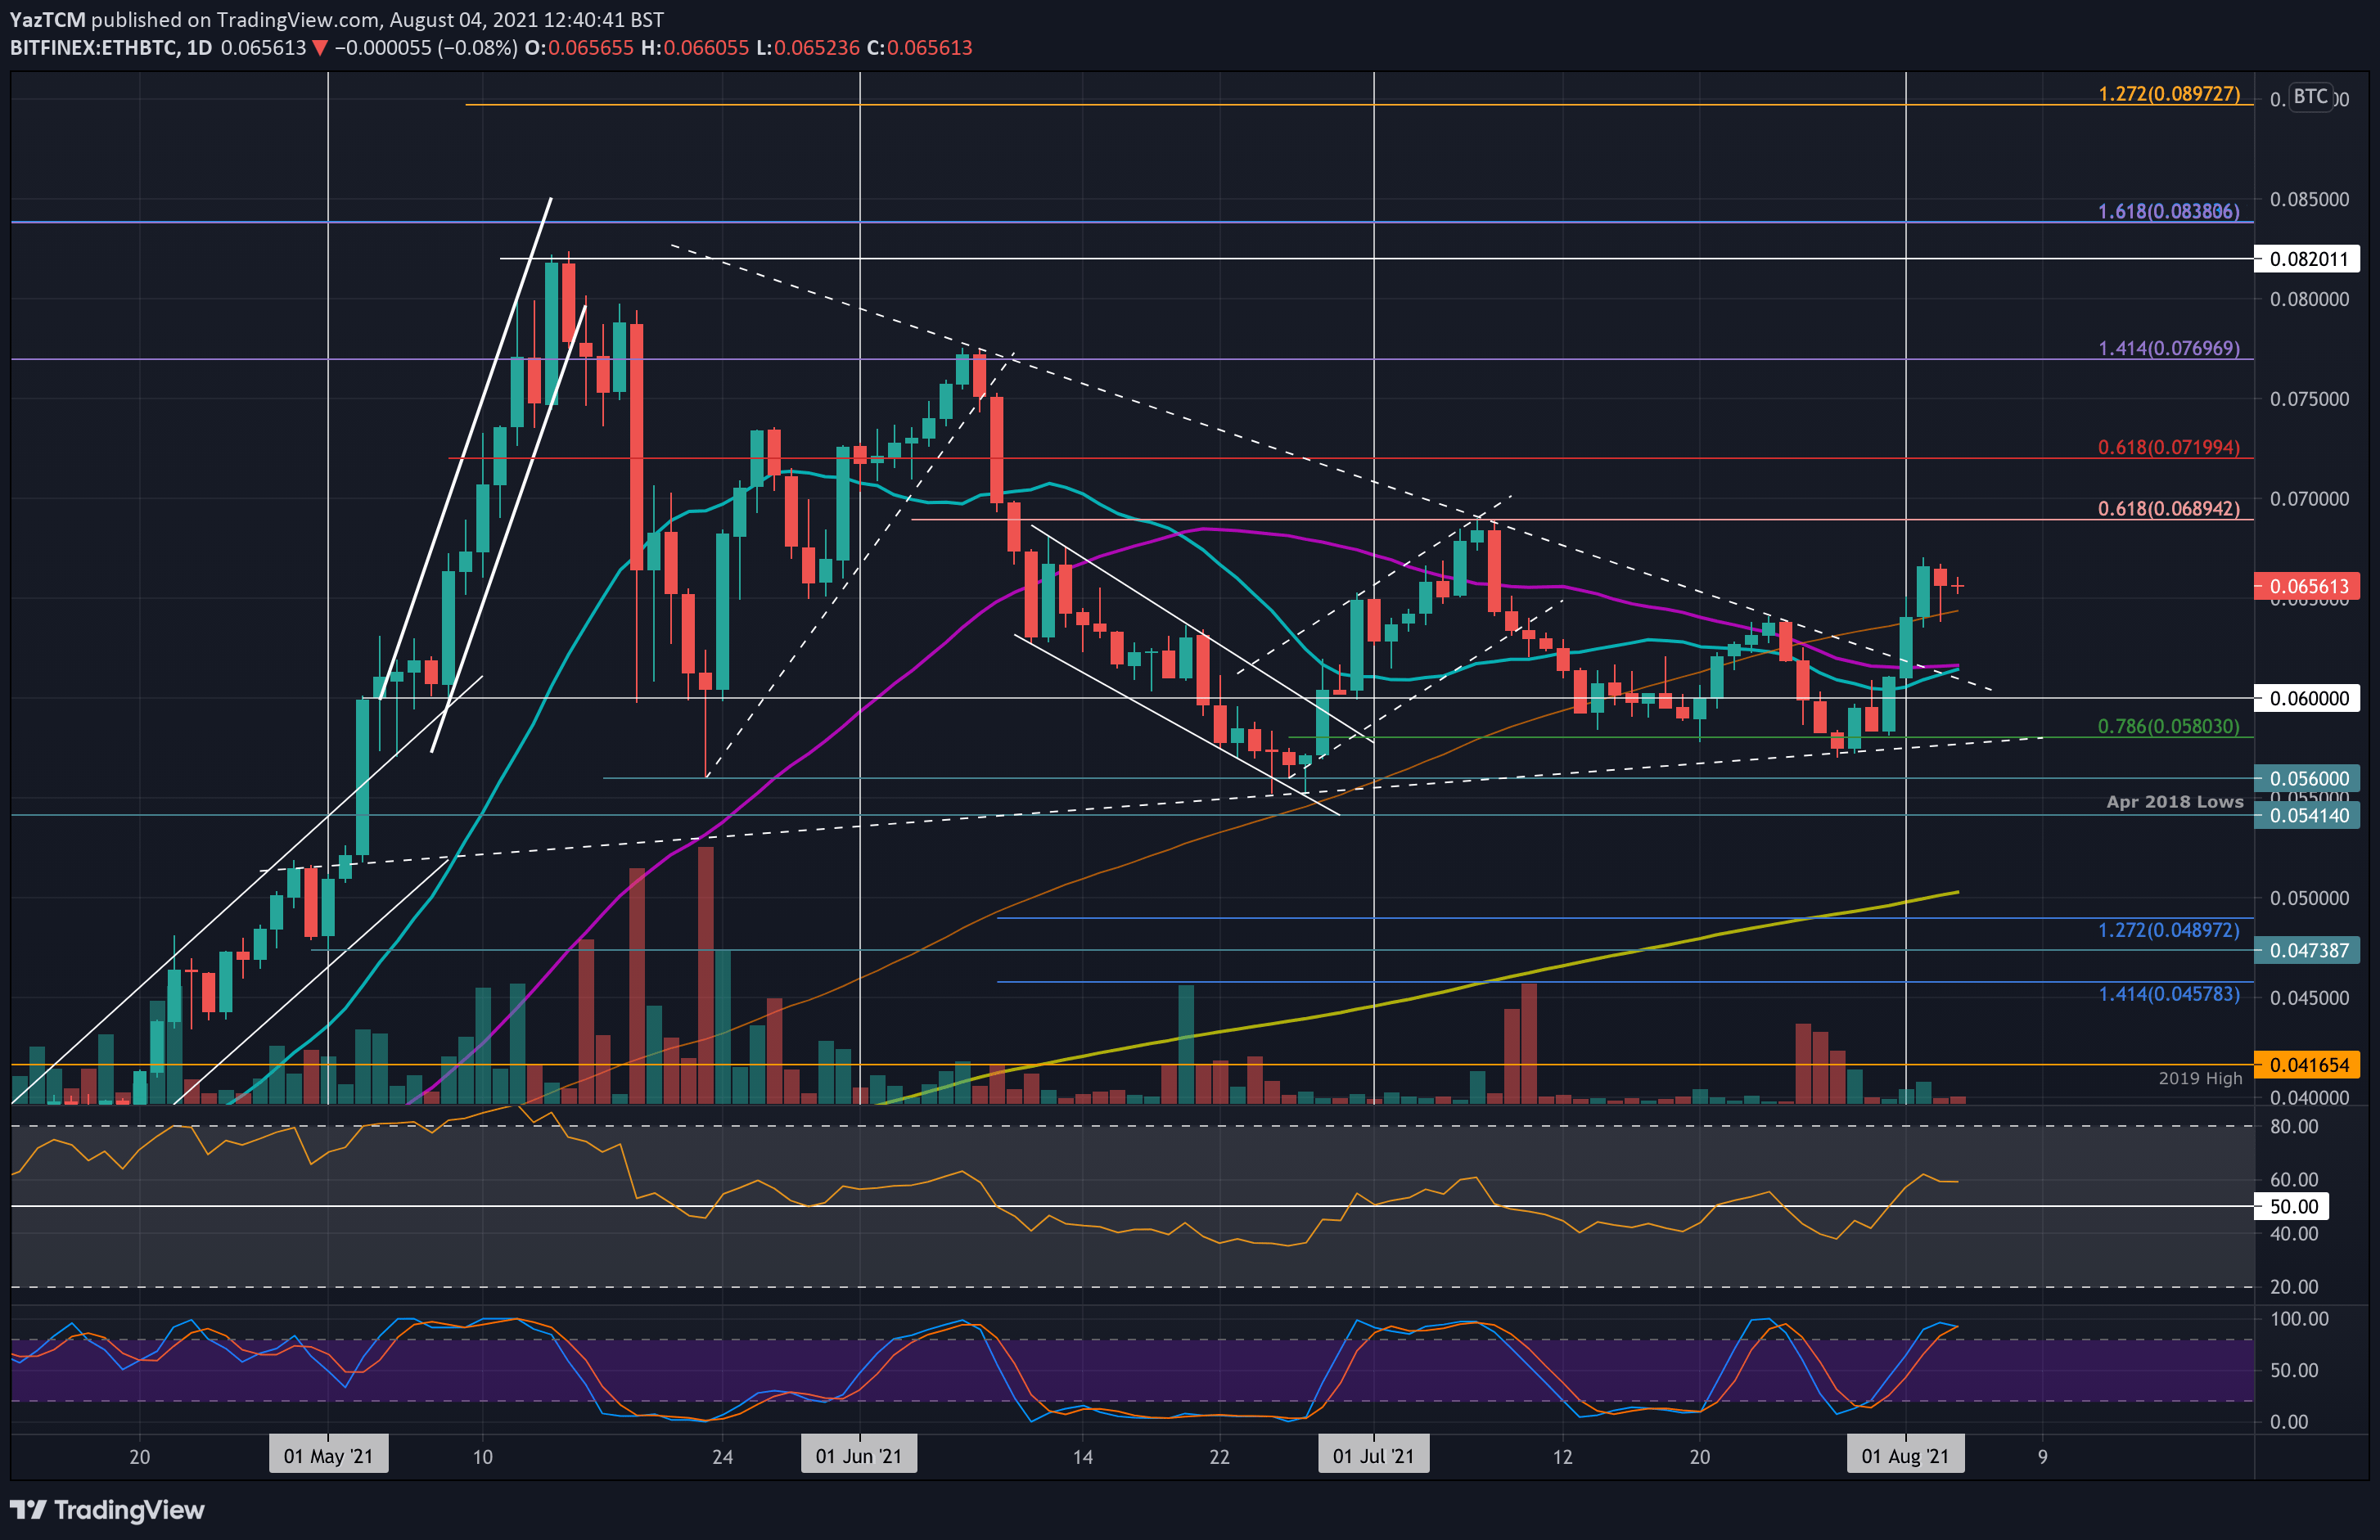
ETH/BTC – ETH Remains Above 100-day MA After Consolidation Break.
Key Support Levels: 0.064 BTC, 0.0616 BTC, 0.06 BTC.
Key Resistance Levels: 0.067 BTC, 0.069 BTC, 0.072 BTC.
Ethereum was trading inside a giant symmetrical triangle pattern for the majority of the past two months. This consolidation was finally broken on Sunday as ETH penetrated above the upper angle of the triangle after passing the 50-day MA at 0.0616 BTC.
Since breaking the triangle, ETH continued upward to pass the 100-day MA at 0.064 BTC and reach as high as 0.067 BTC. It has since dropped slightly to the current 0.0656 BTC level.
ETH-BTC Short Term Price Prediction
Moving forward, the first resistance lies at 0.067 BTC. This is followed by 0.069 BTC (bearish .618 Fib), 0.072 BTC, and 0.077 BTC (July highs).
On the other side, the first support lies at 0.064 BTC (100-day MA). This is followed by 0.0616 BTC (50-day MA), 0.06 BTC, and 0.058 BTC (.786 Fib).
The daily RSI is above 60, indicating the bulls still remain in charge of the market momentum.