Ethereum has suffered from a break down in price action over the previous day as the market drops by 7% to $125.89. This comes only a few days following the Ethereum network upgrades including Constantinople and St. Petersburg hard forks. Despite this recent price decline, the coin is still up by a total of 17% over the past 30 days.
The cryptocurrency remains on the 2nd position on the top cryptos by market cap as it holds a $13.30 billion market cap value.
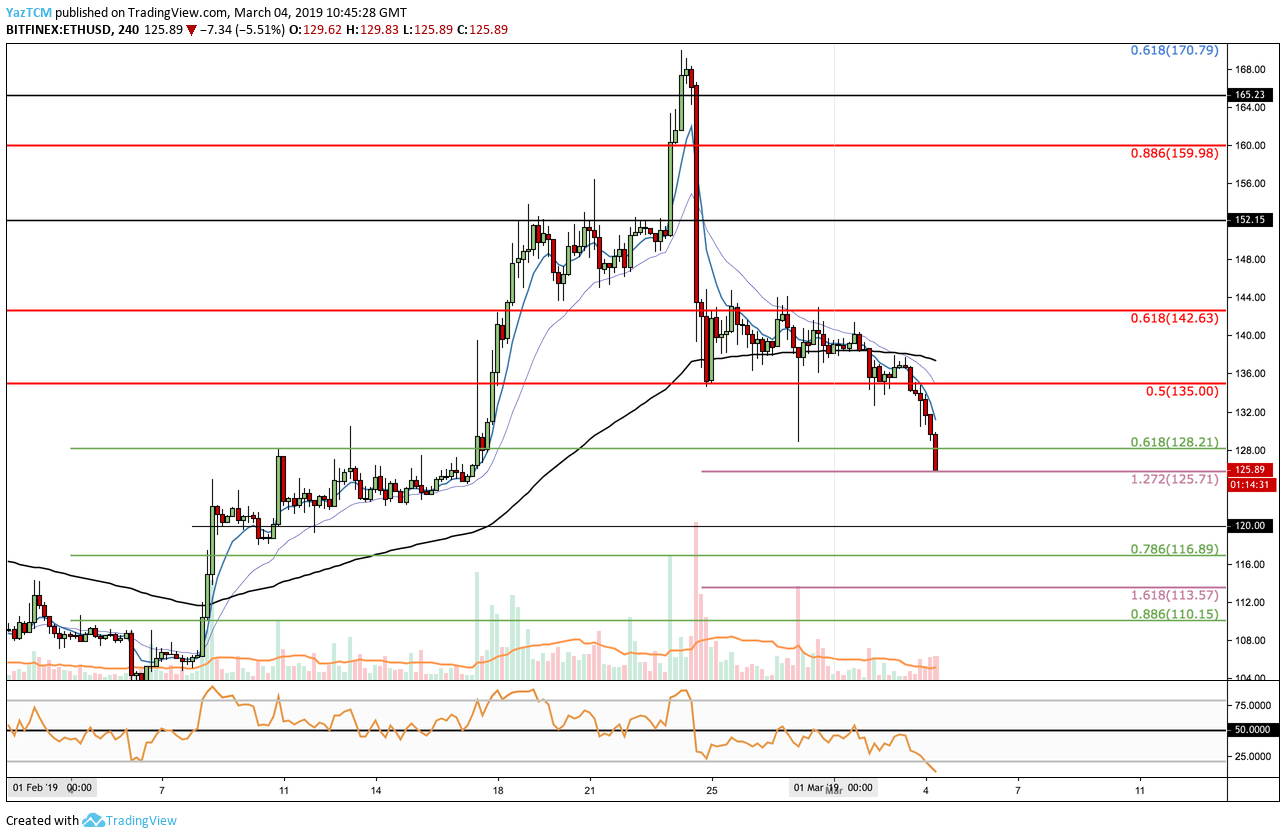
Looking at the ETH/USD 4HR Chart:
- Following our last Ethereum analysis, we can see that the market has recently broken below the previous $135 support, along with the bearish .5 Fibonacci Retracement level (marked in red).
- The coin has fallen further lower as it now trades around the support level provided by a short term downside 1.272 Fibonacci Extension level at $125.71.
- From below: The nearest level of support beneath $125 lies at the $120 level. This is followed with further support at $117 (the .786 Fibonacci Retracement level, marked in green), $113 (the downside 1.618 Fibonacci Extension level, marked in lilac) and the $110 support area.
- From above: The nearest resistance lies at the bearish .5 ($135) and .618 ($142.63) Fibonacci Retracement levels (marked in red). Higher resistance above lies around the $150 area and $160, where lies the bearish .886 Fibonacci Retracement level (marked in red).
- The RSI has plummeted into extreme bearish territory around the 20 level as the bears dominate the market sentiment.
- The trading volume as decreased since the beginning of March, following the stability and the weekend.
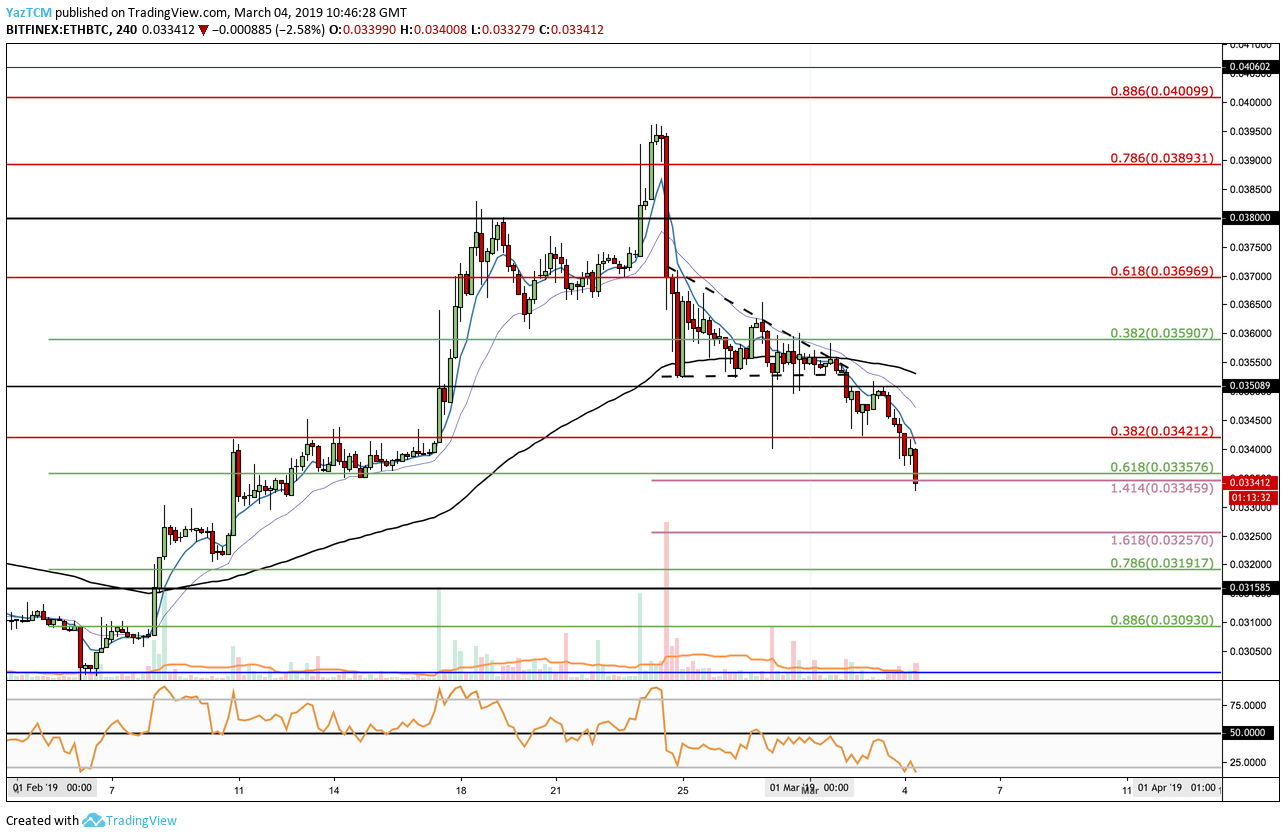
Looking at the ETH/BTC 4HR Chart:
- ETH/BTC has broken beneath our previous highlighted descending triangle. Following the breakdown, the market tumbled beneath support at 0.03421 BTC to the area where it’s currently trading at: support at the downside 1.414 Fibonacci Extension level (marked in lilac) at 0.003345 BTC.
- From below: The next support beneath is the 0.033 BTC, along with the downside 1.618 Fibonacci Extension level at 0.03257 BTC. Further support beneath lies at 0.03191 BTC, 0.003158 BTC and 0.03093 BTC.
- From above: The nearest resistance lies at 0.03412 BTC along with the bearish .382 Fibonacci Retracement level (marked in red). Higher resistance lies at 0.03508 BTC and 0.03696 BTC.
- The RSI has also dropped into extreme bearish territory as the sellers dominate the market sentiment.
- The trading volume has also decreased substantially since February.