
 u.today

One key indicator that keeps $BNB Chain at the top of the stablecoin market is active users. The network currently hosts about 15 million active stablecoin addresses each month, surpassing all rival blockchains in the market, according to recent data from Binance Research and Dune.
Staying dominant
The percentage of active stablecoin users on $BNB Chain was much lower in 2021 than it is now. Since then, adoption has increased significantly, assisting the network in keeping its status as the most popular chain for stablecoin transactions. Although the user bases of Ethereum, Solana, and a number of other significant networks have grown as well, none of them currently match the address activity of $BNB Chain.
Just a quick reminder that $BNB Chain leads all networks with 15M monthly active stablecoin addresses.
— $BNB Chain (@BNBCHAIN) July 12, 2026
Let that sink in. pic.twitter.com/jZcZHfMHZT
The statistic initially presents an extremely optimistic picture. As the main means of trading, payments, transfers, and decentralized finance, stablecoins are frequently regarded as the cornerstone of on-chain activity. In general, a larger stablecoin user base indicates high liquidity and ecosystem engagement. But there is a significant caveat.
Capital concentration is not always correlated with active addresses. Although $BNB Chain has the most users, it does not necessarily have the highest market capitalization, transaction value, or institutional adoption of stablecoins.
Because of $BNB Chain's accessibility and low fees, many users on the network carry out smaller transactions. Meanwhile, rival ecosystems like Ethereum, which have fewer active addresses, nevertheless attract sizable amounts of substantial capital flows.
The difference matters from a market standpoint. Investors should refrain from assuming that all active users contribute equally to economic value, even though high address activity indicates retail participation and network utility. This conflicting picture is reflected in $BNB's price action. On the daily chart, $BNB continues to face pressure despite the network's robust fundamental adoption metrics.
$BNB's market performance
After months of lower highs and lower lows, the asset is now trading close to $573. The fact that the price is still below its 50-, 100-, and 200-day moving averages suggests that the general downward trend has not yet been broken. Although buyers have not yet generated enough momentum for a sustained breakout, the RSI has recovered toward the neutral 50 level, indicating that selling pressure is lessening.
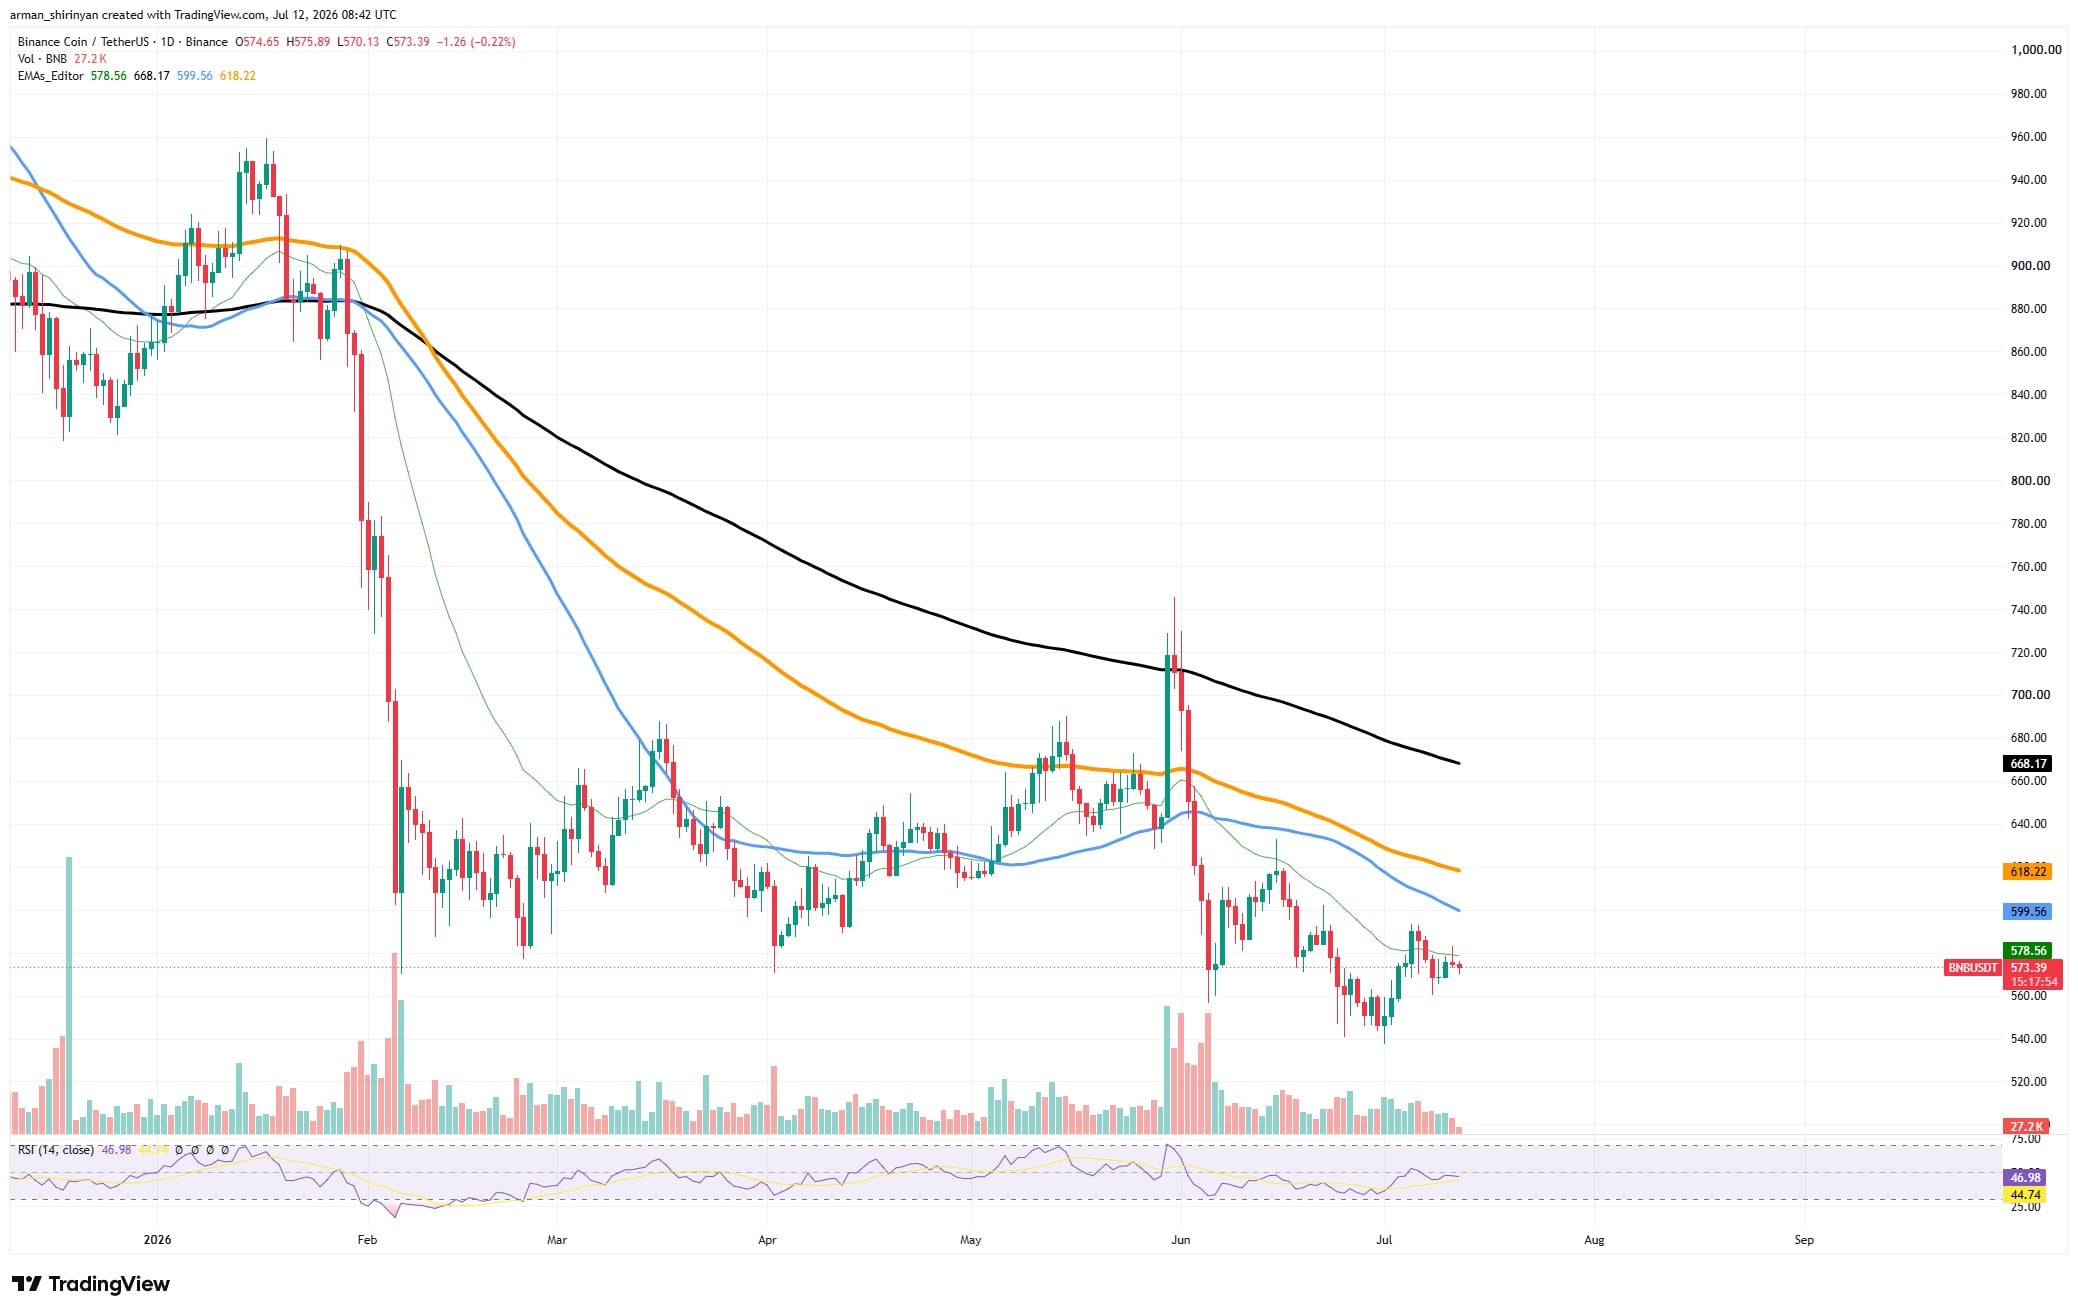
Stronger barriers at the 100-day and 200-day averages follow the immediate resistance, which is still close to the 50-day EMA at $579. The network's significance in the stablecoin economy is demonstrated by $BNB Chain's continued impressive user activity leadership.