Highlight:
Following the January 10 sell-off from $4200 resistance; positioned Bitcoin (BTC) on a long squeeze has shown a very weak market. Another Bart Simpson pattern is likely building.
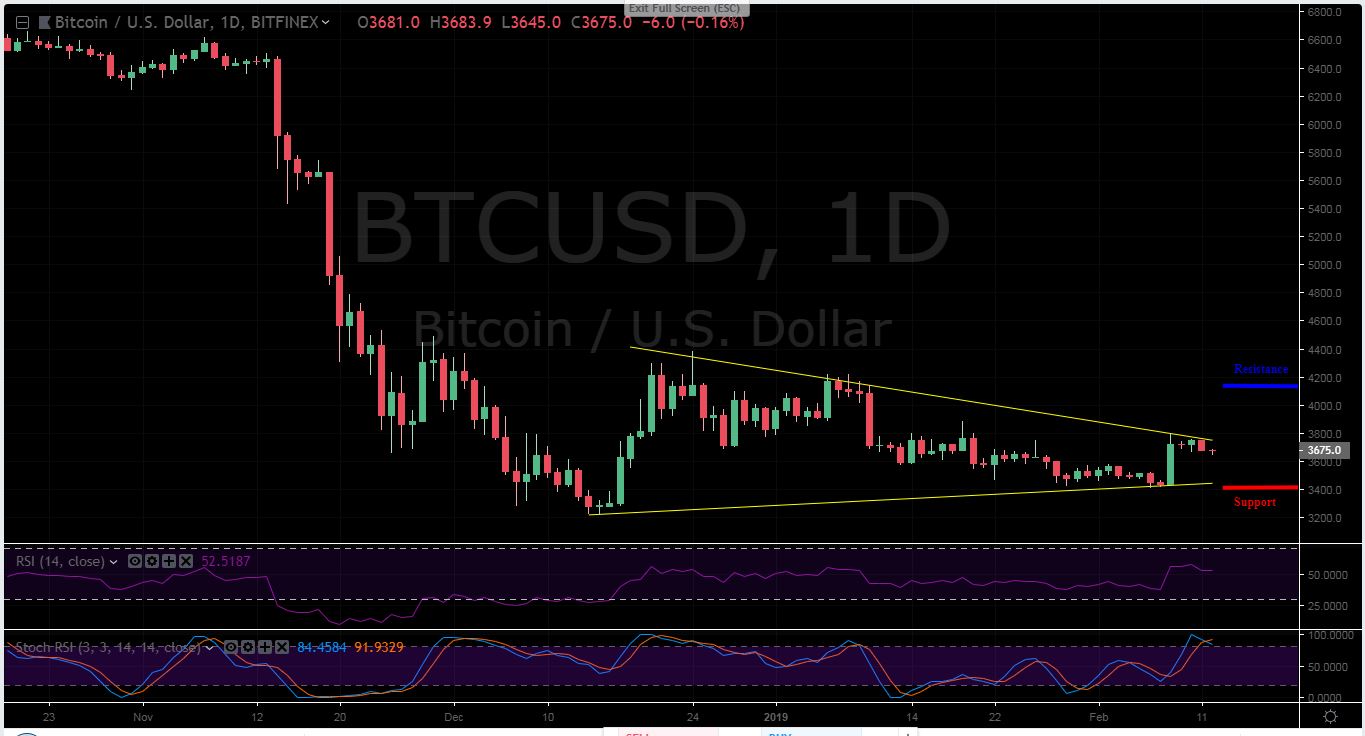
BTC/USD Long-term Trend: Bearish (1D chart)
Key Levels:
Resistance levels: $4200, $4500, $5000
Support levels: $3400, $3200, $3000
Last Friday, the price saw a sudden surge to $3800; formed a bullish engulfing candle pattern. Ever since, the market maintained its routine squeeze and trading above $3400 support level. This could be a bear-trap as trading pressure already sleeps in the overbought zone of the daily Stochastic RSI. A pull might reach $3400.
Before the surge, the CoinMarketCap statistics revealed Bitcoin’s trading volume around $5 billion plus. But today, it’s estimated at $6.5 billion approximately; increased by $1.5 billion.
Now, the price bars remained in the symmetrical triangle range as trade nears a critical tight angle. A trend line break is expected to take price to the next move. The bull would found resistance at $4200 as bear target lies $3200 support. However, the RSI is now trending low; signaling a potential drop.
BTC/USD Medium -term Trend: Bearish (4H Chart)
For a long period, the market structure has been known for its common “Bart Simpson Pattern”; which usually followed by an unexpected positive move with consolidation before returning to the existing rally. It’s mostly used to signal a false breakout. However, it’s too early to celebrate the positive move. The RSI currently reveals a sell trade as it shoots low.
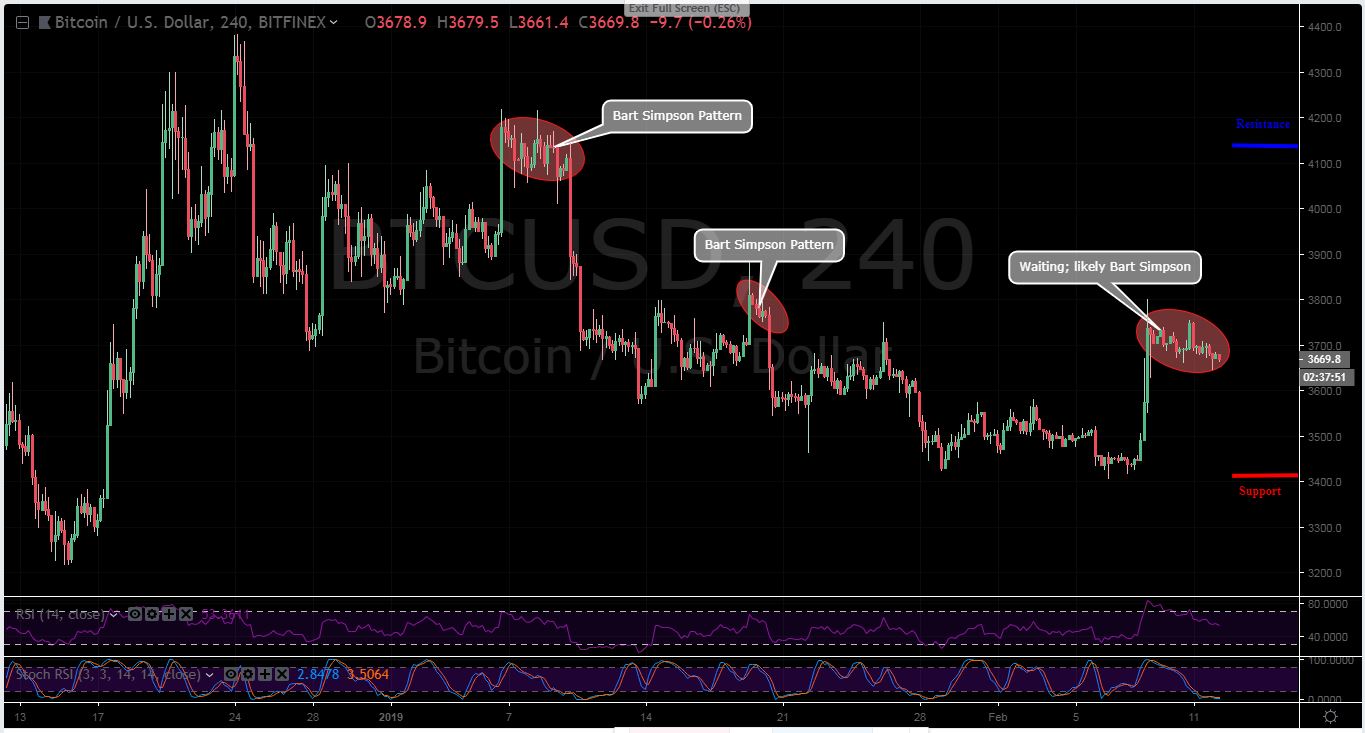
Observing the previous Bart Simpson, obviously, the bull walks up to the steps; the bear jumps out of the window. Here is likely another anticipating low swing. Otherwise, the big wave would fly price to $4200 resistance. There, it can be considered a rising market. At the moment, the price is still scary.
Viewing the Stochastics RSI, trading pressure is at its lowest level; the bear play seems over. The trend is likely to take a north rally as the bull decides to push pressure higher. Resting at the oversold would slowly take price to $3400 support.
Bitcoin and Bart Simpson pattern are closely related. Here’s the clear explaination from 2018 by Crypto Dog:
Typical Bart Simpson pattern on #Bitcoin $BTC / $USD pic.twitter.com/4nIjuFWHxD
— The Crypto Dog📈 (@TheCryptoDog) March 27, 2018
Please note: Cryptovibes.com is not a financial advisor. Do your own research before investing in any financial asset. We are not responsible for your investing results.