Bitcoin price analysis is bordering bullish region as buyers have sustained the price above $22,100. It seems buyer confidence has returned in the crypto market as most major coins are trading well above the support zone. Even the market capitalization of the crypto market is now back above the psychological $1 trillion mark. So, is the bear market phase over in the crypto market?
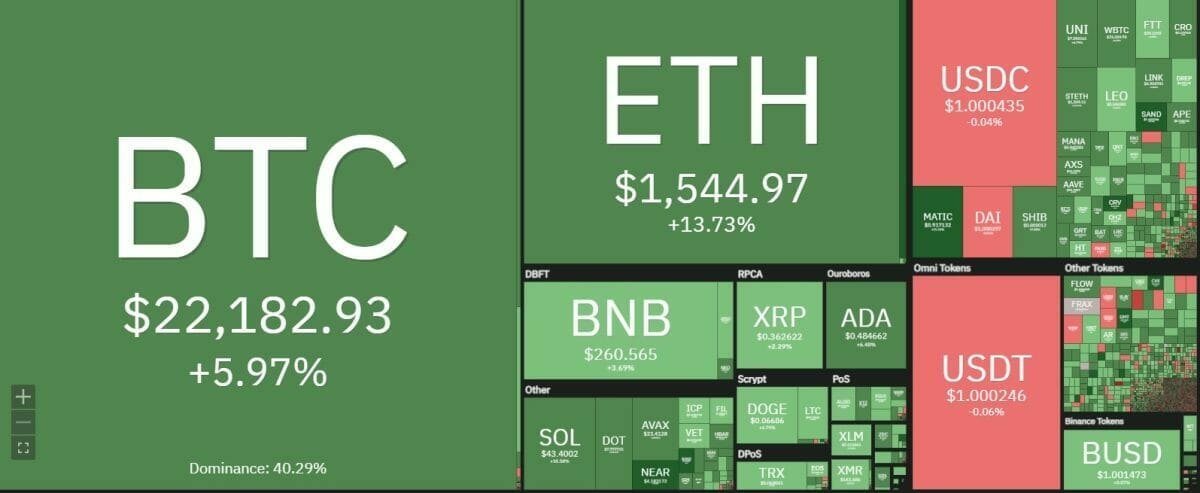 Source: Coin360
It is impossible to predict the end of the bear phase with a singular rise in the price action. However, sustained price moves above the support zone at $21,000 does inspire confidence among the bulls as per Bitcoin price analysis. If the bulls are able to maintain momentum despite headwinds, there may be a move towards $25,000 in the short term.
Bitcoin price movement in the last 24 hours: Bulls are back in the business
Bitcoin price analysis shows that the BTC/USD pair was lingering near $20,900 region close to the 20-day exponential moving average. Yesterday, the BTC/USD moved decisively above the $22,000 area. by breaking the resistance region contained in the descending symmetrical triangle. Such a move signals a trend reversal on the candlestick charts.
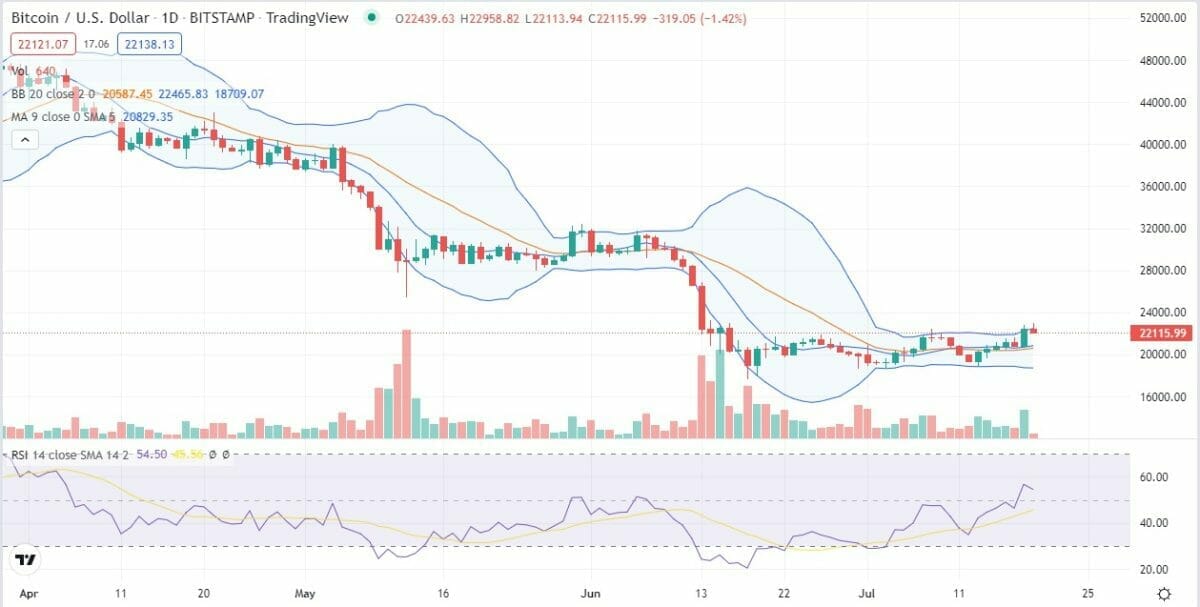 Source: TradingView
The ‘Relative Strength Index’ indicator shows 55 reading on the hourly charts reflecting a higher bias in the price action. The shift into the positive territory has the buyers inspired to buy BTC/USD and demolish the barrier at $23,000 next. Large volumes pouring into the pair can swiftly take the pair near $25,000 in this week provided there’s no adverse news according to Bitcoin price analysis.
BTC/USD 4-hour chart: Breakout from descending triangle means end of bearish phase?
The current confidence in the buyers needs a lot of confirmations before establishing itself. The descending triangle requires a decent breakout with large volumes for the buyers to pump in more money into the market. Only momentum can take the pair above $23,600 resistance zone. The hourly indicators show that overhead resistance zone is aggressively backing bears to establish another move lower.
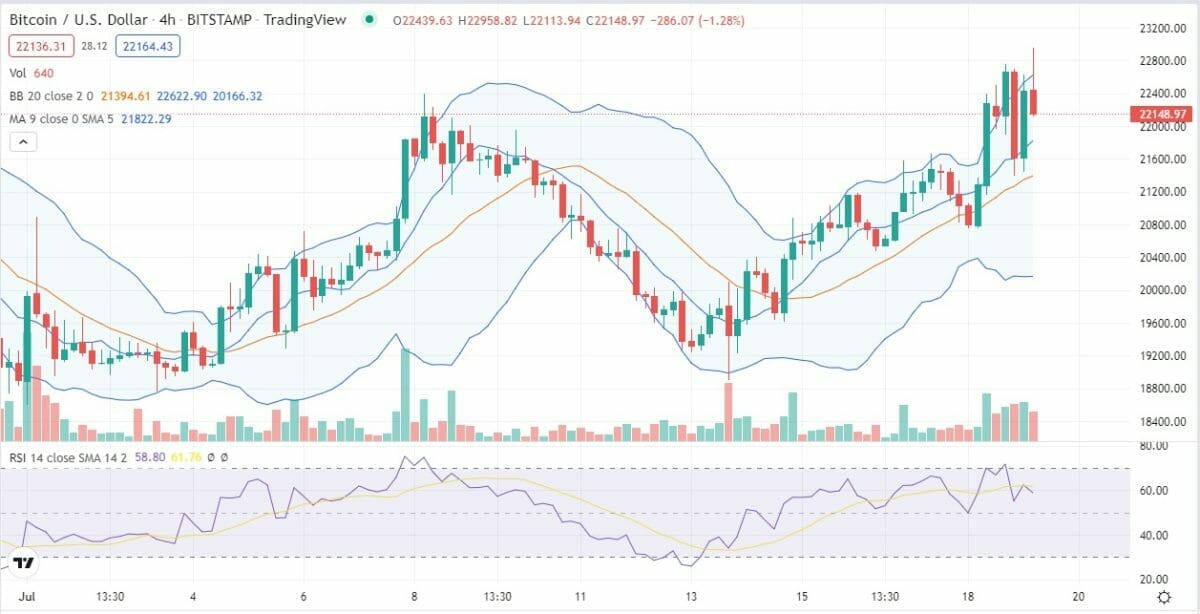 Source: TradingView
A consolidative price action in the region near $22,000 will also help the bullish case. Ethereum is a fine example of how a coin has broken past the descending triangle pattern to sustain above the resistance zone. The first resistance on the hourly charts is coming up near $22,700.
Bitcoin price analysis: Day traders rejoice as BTC delivers short-term gains
The current move will likely create a base for the upcoming bullish moves. The directional setup will help the pair make higher lows on the charts which in turn will signal bullish bias. The price can target earlier swing highs on the rising price channel. A mix of resistance and support zone moves can place the pair firmly in the bullish zone.
The short-term trading range seems to the between $21,000 and $24,000. The EMA at $23,390 will beckon the bulls and promote the bears too to setup short traders. Bitcoin price analysis shows it is a day trader’s delight. Scalpers can also benefit from the recent up move and can target $23,000 initially.
Disclaimer. The information provided is not trading advice. Cryptopolitan.com holds no liability for any investments made based on the information provided on this page. We strongly recommend independent research and/or consultation with a qualified professional before making any investment decisions.