Bitcoin has continued its fall, going down by 4% over the last day.
BTC/USD
Bears have locally seized the intiative as bulls could not return the rate of Bitcoin (BTC) to the $21,000 mark.
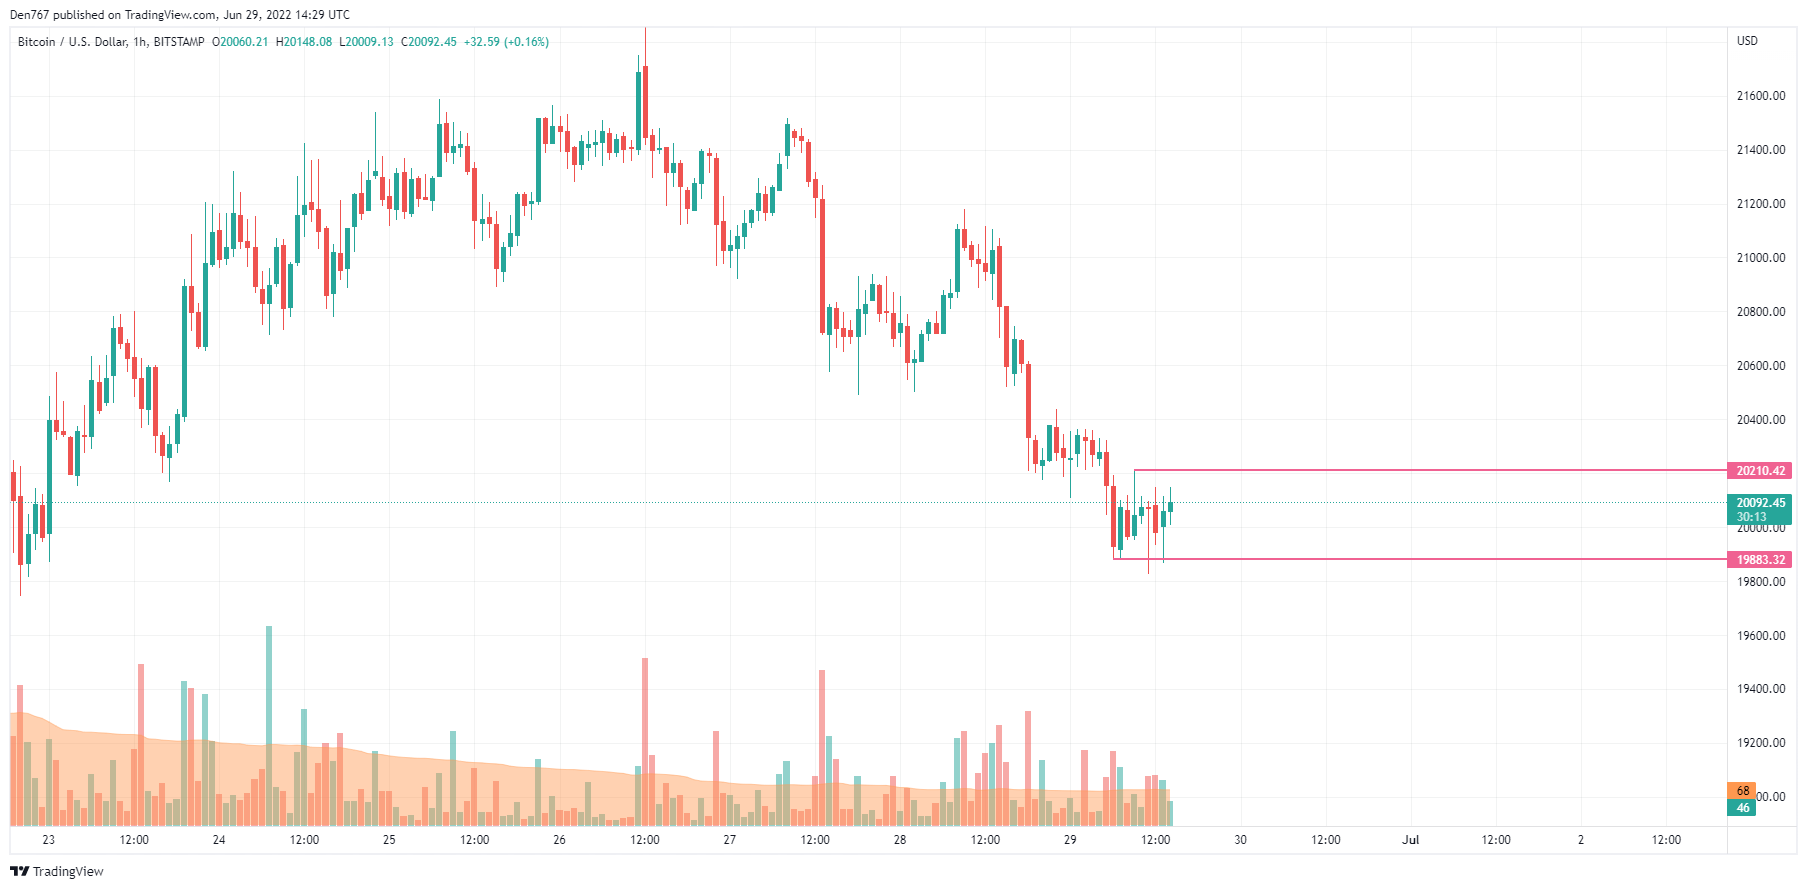
On the hourly time frame, Bitcoin (BTC) is trading in a narrow range between the support at $19,883 and the resistance at $20,210. At the moment, the price is located in the middle of the channel, which means that neither bulls nor bears are dominating.
However, if buyers can hold the rate above $20,000, short-term growth may happen.
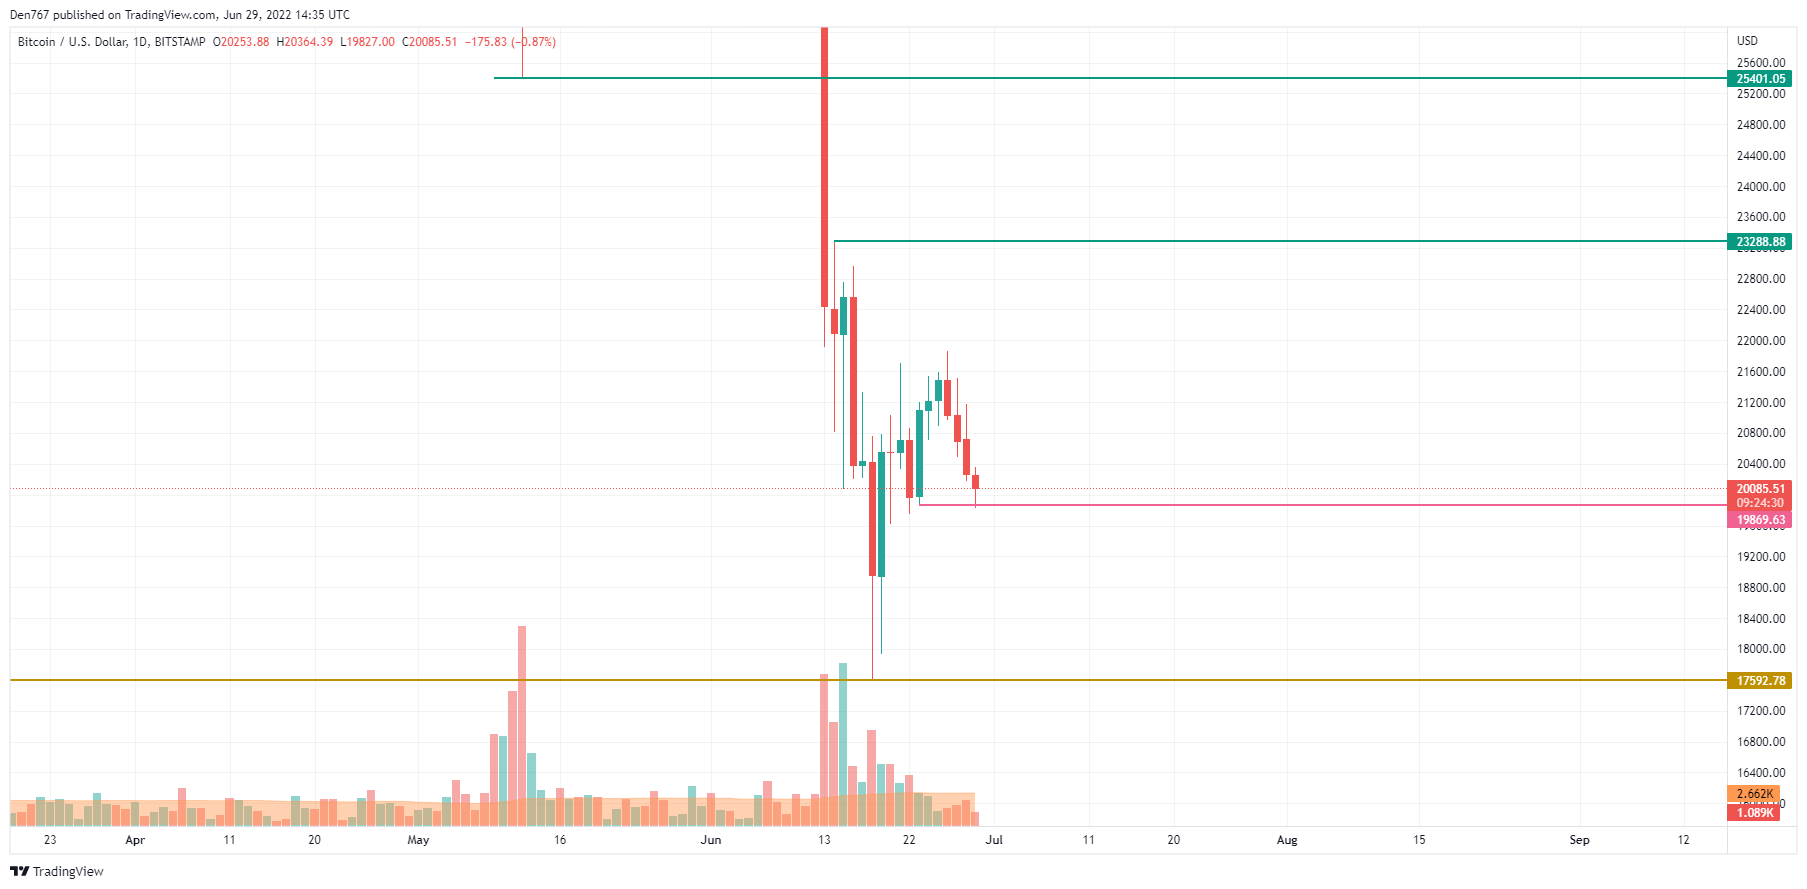
On the longer-term chart, Bitcoin (BTC) has made a false breakout of the $19,869 level. The selling volume has risen, confirming sellers' power. However, if bulls can keep the rate above the mentioned mark, one can expect a bounceback soon.
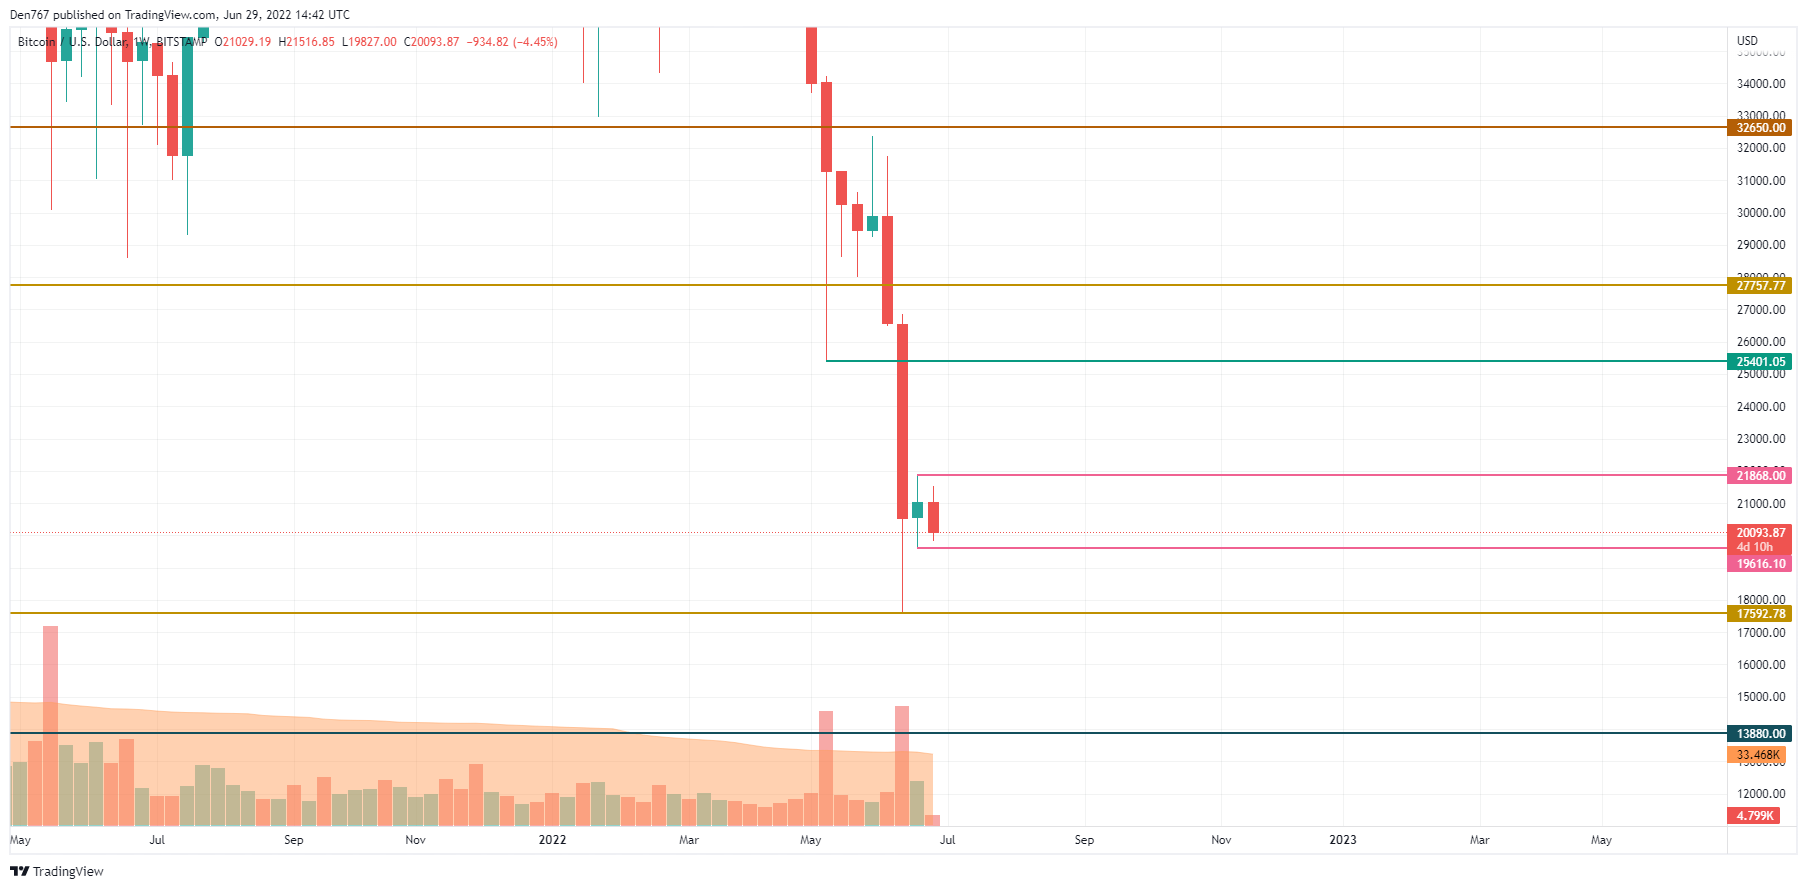
From the mid-term point of view, Bitcoin (BTC) is trading in a narrow range that neither bulls nor bears are signaling. However, if the candle fixes below the $20,000 mark, the fall may continue to the next support level at $17,592.
Bitcoin is trading at $20,098 at press time.