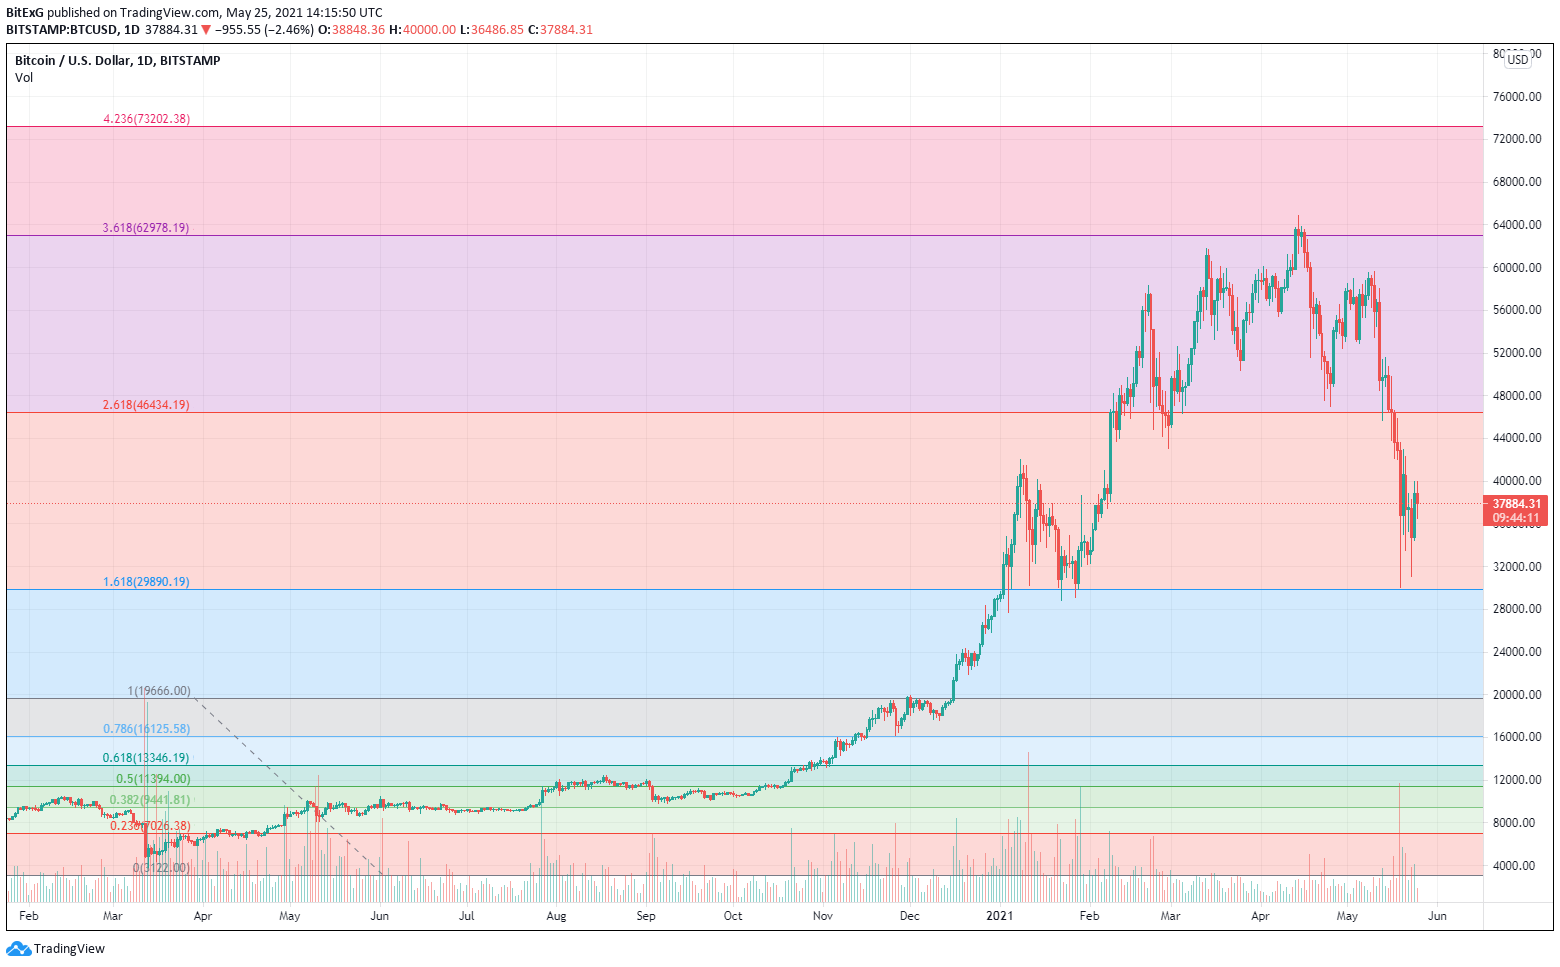
After months of near-consensual approbation across mainstream media of Bitcoin as a matured asset class and a store-of-value rival for gold, the last couple of weeks has certainly put paid to any notion arguing prematurely for Bitcoin’s merits as a potential risk-off asset. This is no condemnation of Bitcoin. It is a reminder that Bitcoin’s maturation is a multi-decade process, and while Bitcoin is inherently antifragile, this is a market still far from inspiring unequivocal faith in investors. BTCUSD closed last week’s trading session at $34,707, down 25% from the previous week to close out a second successive weekly loss in excess of 20% for the first time. In my analysis a few weeks ago, I suggested that we could be in for a corrective phase over the next month or two, but the precipitous nature of this correction was not something that could have been anticipated. But then, who could have anticipated this perfect FUD storm all at once? We’ve even had the statutory bull-market China ban FUD for good measure, and surprisingly, it still works! After breaching multiple support levels, BTCUSD ultimately found a strong recovery bounce at the last established support level of $30,400 prior to Tesla announcing their Bitcoin purchase back in early February. An immediate recovery was thwarted at the previous support level of $43,000, which has now turned resistance, and the pair is in the process of establishing support at $37,500 before aspiring to reclaim $43,000. Each of the levels in the chart below, first identified in my previous analysis from a few weeks ago, are likely to offer resistance on the way back up. 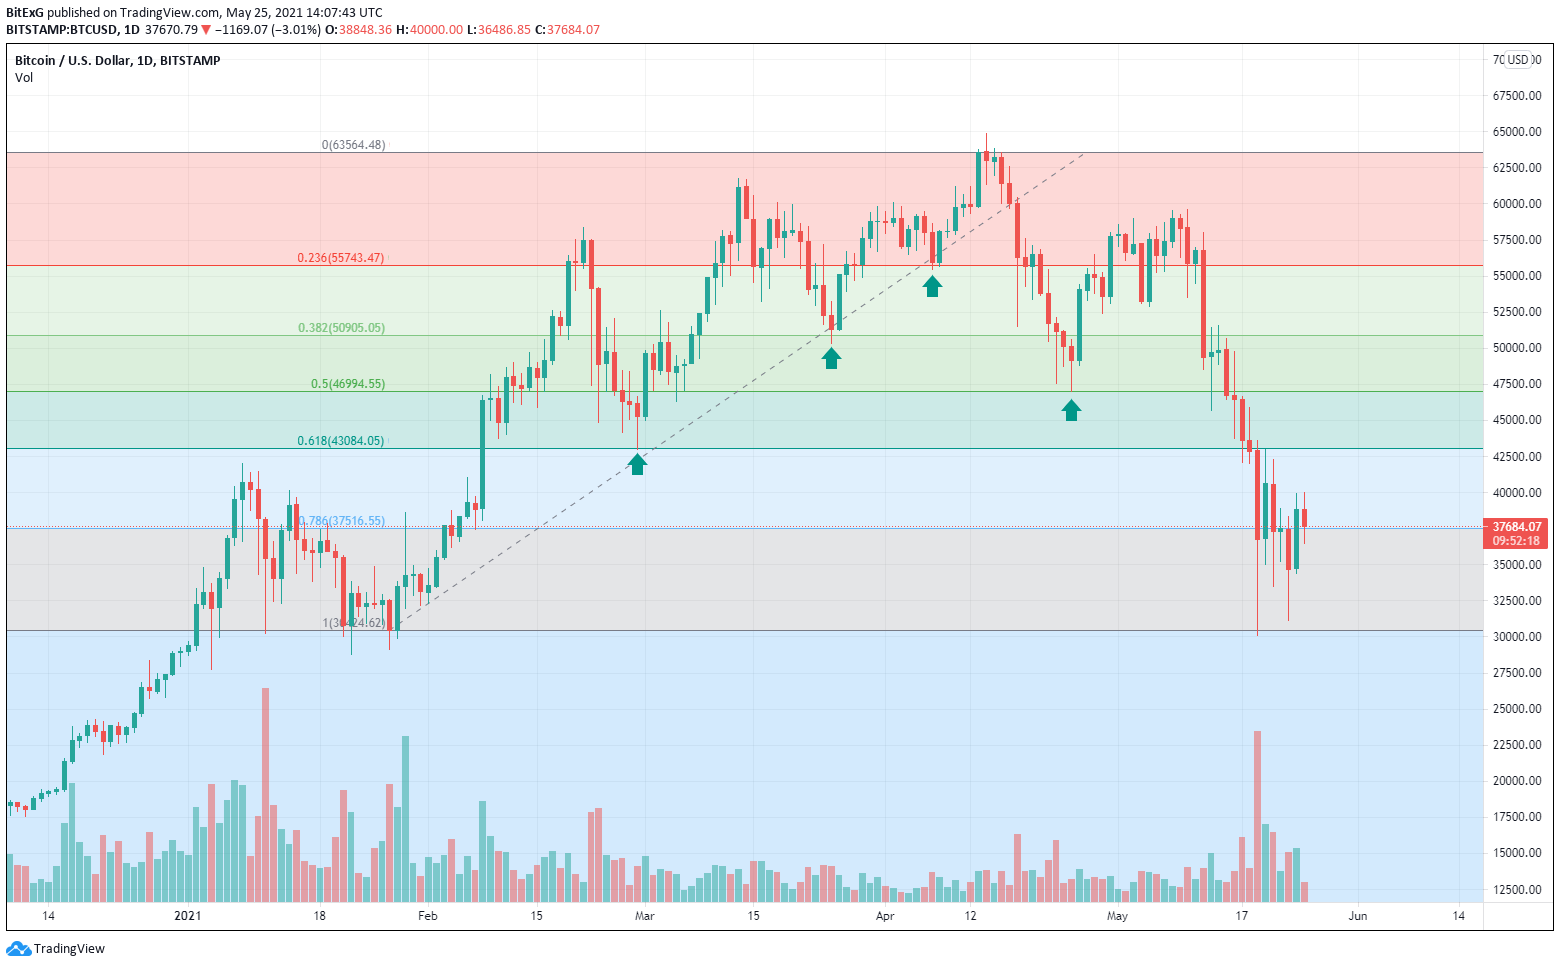 The significance of $30,000 is further confirmed by charting long-term Fibonacci extensions. Being able to retain this support level is critical to ensuring that the primary trend remains bullish.
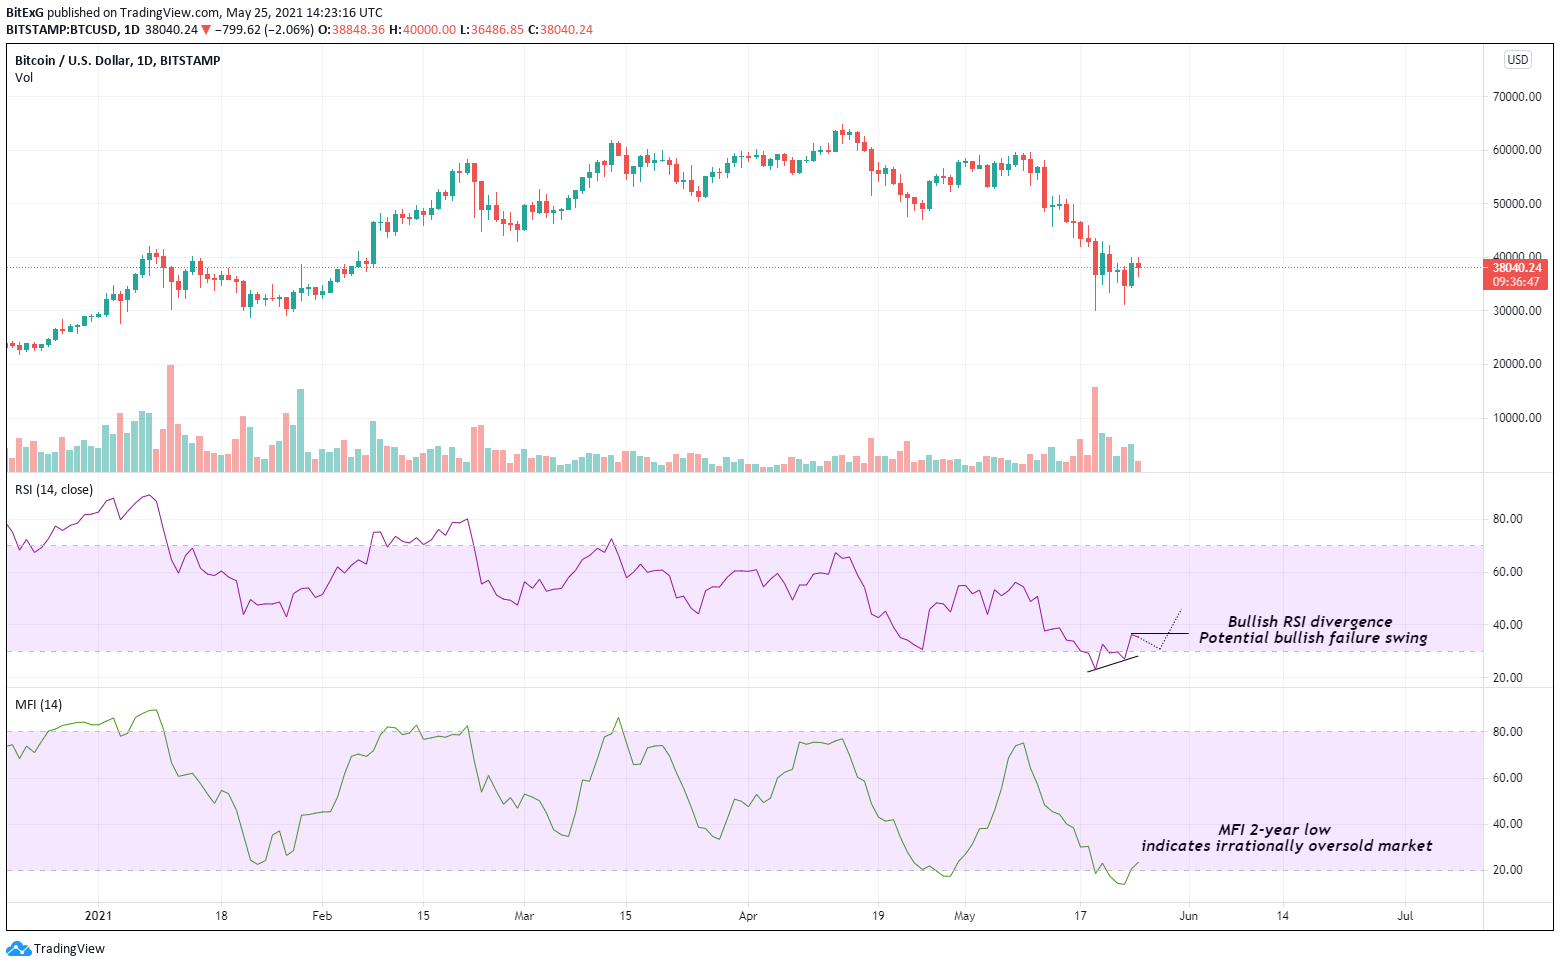
  Daily RSI indicates a bullish divergence in oversold territory which could further transition into a bullish failure swing (as illustrated by the dotted line in the chart below), which is among the strongest signals of a reversal. Money Flow Index (MFI) meanwhile indicates that the market is currently irrationally oversold. This is further confirmed by various on-chain metrics, which indicate capitulation from short-term holders as long-term holders accumulated.
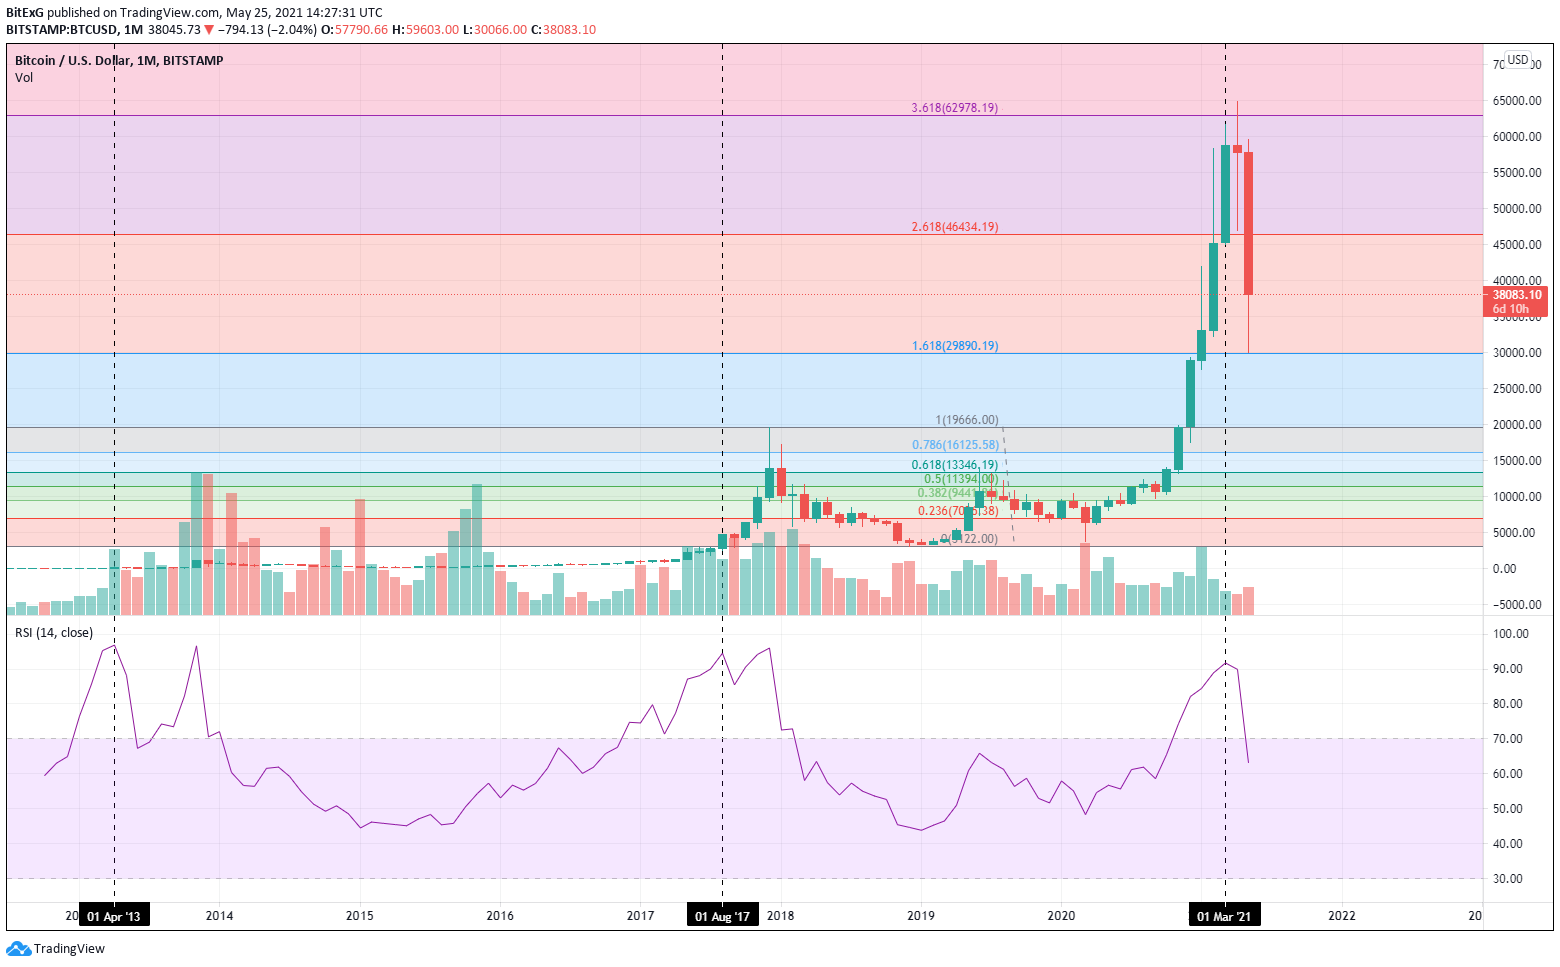
  Finally, looking at the monthly chart, it is clear that this cycle is likely to resemble the 2013 bull cycle rather than 2017, with a relatively early first peak, followed by a sharp correction and consolidation before scaling new highs towards the end of the year. The duration of the corrective phase could be determined by whether BTCUSD is able to close the monthly session above $43,000 in just under a week’s time.
Market Summary
- Key support levels: $30,400, $34,700
- Key resistance levels: $40,000, $43,000
- Market outlook: Bullish recovery
 bitcoinexchangeguide.com