Bitcoin witnessed a solid 8% price spike today, including a $2000 rally over the past few hours alone. While today’s low lies below $30K, the current high reached $34,300 (according to Bitstamp). Incredible.
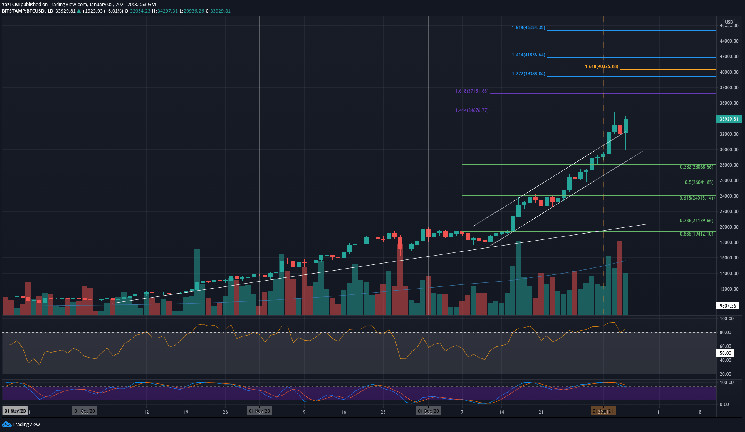
As can be seen on the 4-hour chart below, once Bitcoin breached the marked descending trend-line, the missile had launched. One 4-hour greenish candle spiked BTC from $32K straight to $34.3.
The total crypto market cap surpassed $900 billion, the market is closing down on $1 trillion for the first time. While Bitcoin is on the rise, the altcoins are losing their value against the primary cryptocurrency, as the Bitcoin dominance is increasing, just like most the past week.
BTC Price Support and Resistance Levels to Watch
Key Support Levels: $33,000. $32,100 (breakout zone), $31,345, $30,300, $30,000, $29,300.
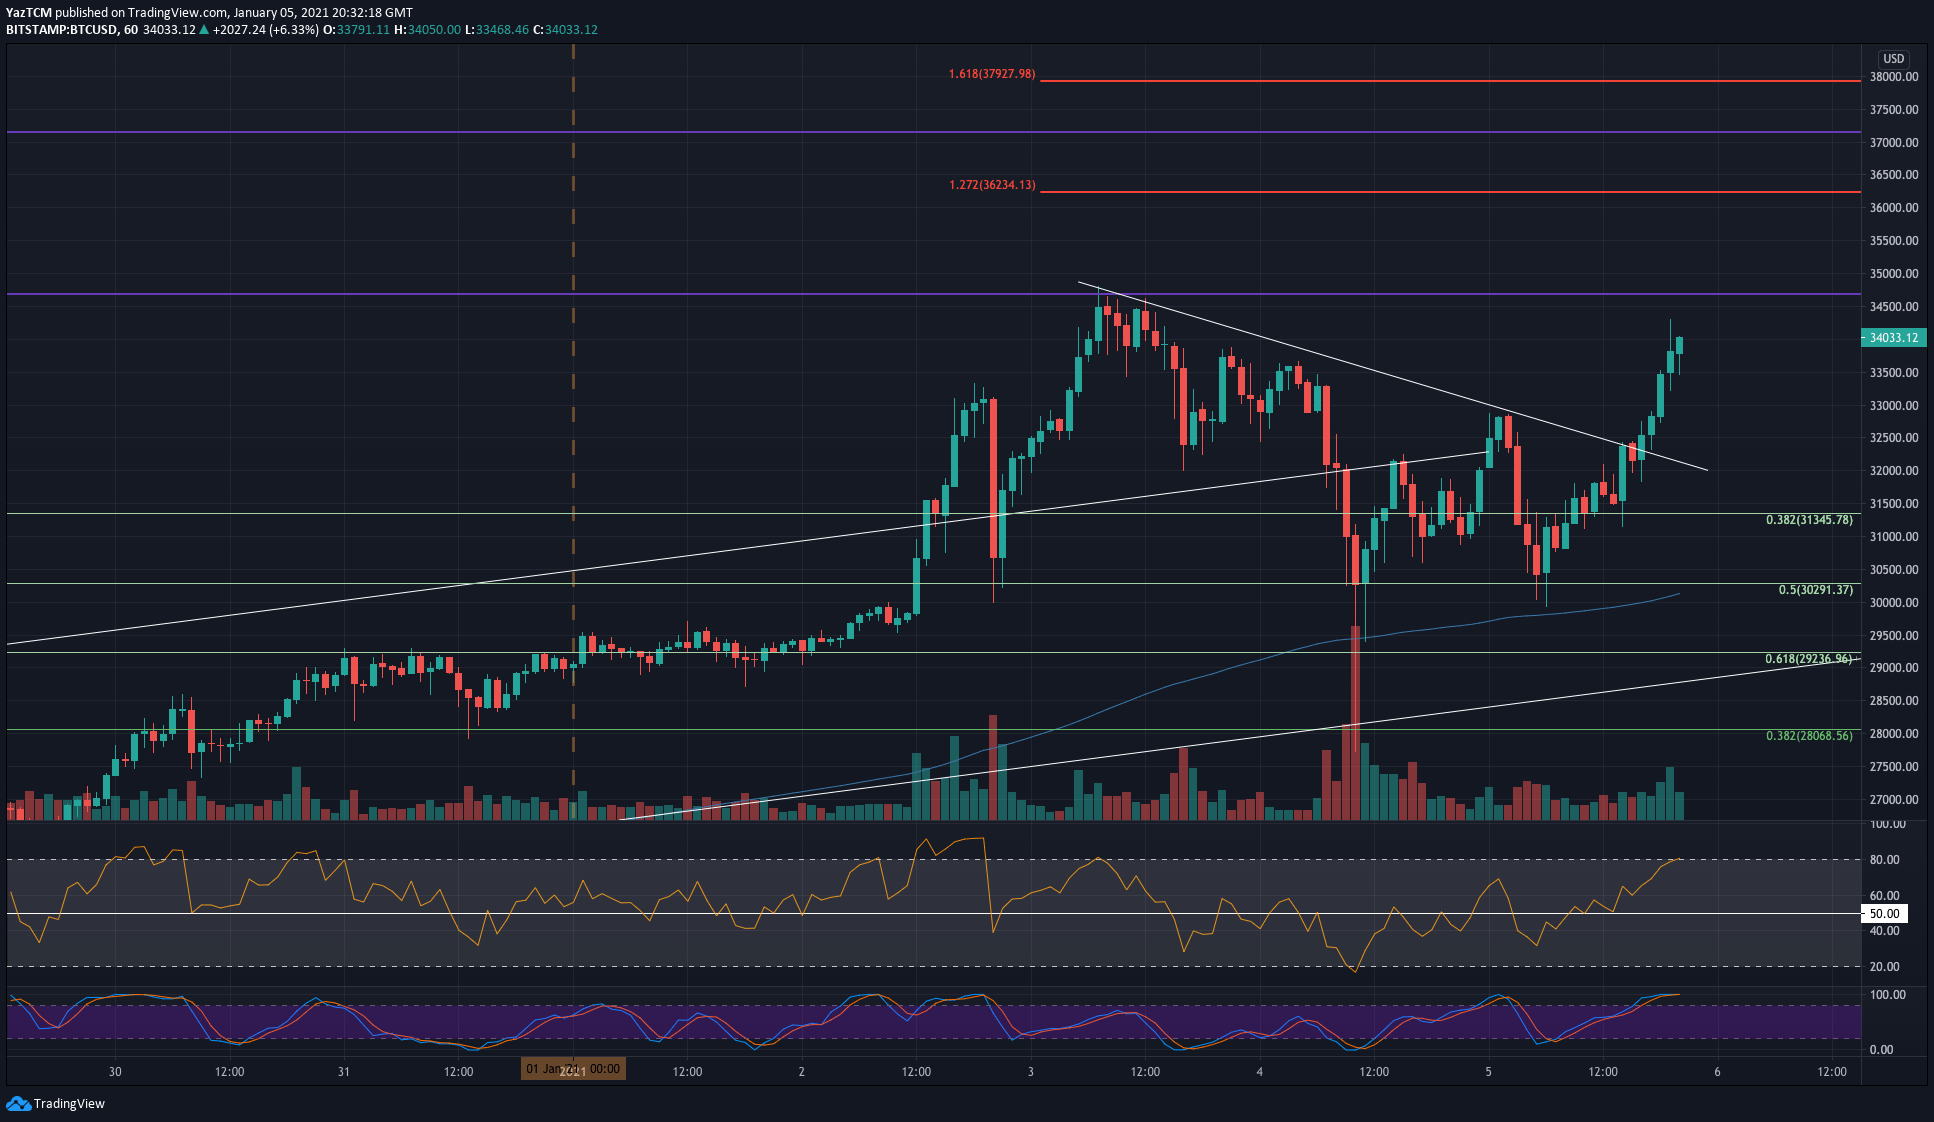
Key Resistance Levels: $34,680 – $34,800, $35,500, $36,000, $36,235, $37,150.
Looking ahead, the first level of resistance lies between $34,680 (1.414 Fib Extension) and $34,800 – $35K (the current ATH from two days ago, January 3rd). Further above lies $35,500, $36,235 (short term 1.272 Fib Extension), and $37,150 (1.618 Fib Extension).
On the other side, in case of a correction, the first major level of support lies at $33,000. This is followed by $32,100 (breakout zone on the 4-hour’s), $31,345 (short term .382 Fib), $30,300 (short term .5 Fib), and $30,000. Additional support lies at $29,300 and $28,000.
Technical indicators: As mentioned here two days ago, we correctly identified a bearish divergence on the shorter term 4-hour chart. This occurs as the RSI indicator is creating lower lows, at the same time as the price goes through higher highs. Following yesterday’s heavy correction, the RSI dropped sharply, giving space for today’s massive move.
Bitstamp BTC/USD Daily Chart
Bitstamp BTC/USD 1HR Chart