Bitcoin Hits $57.8K Target as Analyst Maps BTC’s Next Move
coinedition.com
5 h
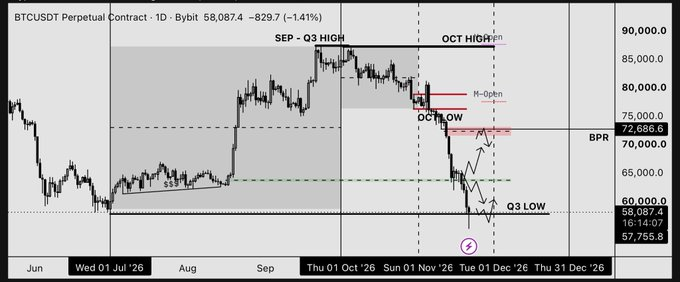
Bitcoin has fallen to the $57,800 area that crypto analyst Lennaert Snyder had identified as a key liquidity target. The decline followed weeks of selling, with $BTC losing the $63,400 level before moving toward its third-quarter low.
Snyder revisited that setup in a November 21 post on X, explaining how the breakdown developed and why he had expected prices to reach the lower level. His BTCUSDT daily chart from Bybit showed Bitcoin trading around $58,087. With the downside target reached, the question now is whether $BTC can recover some of its losses or remain under pressure.
$BTC Price Reaches $57.8K as Former Support Turns Into Resistance
The move began with Bitcoin losing an important daily imbalance around $63,400. Snyder had identified that area as a possible selling opportunity if prices returned to it after breaking lower.
Know when your coins move
Alerts, real-time prices, and market news — all in one app
Point your phone camera to install
4.8 based on 40K reviews in the App Store and Google Play
That is what followed. Bitcoin retested the area, failed to reclaim it, and continued falling. “We lost the $63.4K daily imbalance,” Snyder wrote, explaining that he had highlighted a shorting scenario once the level turned into resistance.
Source:X
He also pointed to a bearish imbalance on the four-hour chart, which added to the resistance already visible on the higher timeframe. From there, Bitcoin continued toward $57,800, the Q3 low Snyder had marked as his final liquidity objective.
The analyst confirmed that the move had played out as anticipated, although he did not suggest an immediate recovery. “We printed, we reached our target, price will probably consolidate for a bit and it’s weekend now,” he stated.
Related: Peter Schiff Warns of Bitcoin Crash Below $56K
Can Bitcoin Reclaim $63.4K and Rally Toward $72.7K?
The next area to watch is $63,400, where Bitcoin previously struggled after losing support. A recovery toward that level would bring $BTC back into the same resistance zone that preceded the latest decline.
Moving above it could open a path toward $70,000, followed by the $72,686 region marked on Snyder’s chart. The higher zone also contains a balanced price range, making it another potential area of resistance if the recovery extends.
There is still a downside scenario. Should Bitcoin fail to regain $63,400, the market could revisit the $57,800 low. Snyder’s chart also illustrates the possibility of price moving below that area before recovering.
For the immediate period, however, his focus remains on consolidation following the liquidity sweep. “It’s important not to rush into positions and give the price some time to stabilize here,” Snyder wrote.

 coinedition.com