Bitcoin Price Prediction: CZ Lists 5 Reasons BTC Is Falling, and Admits Nobody Knows
coinedition.com
19 h
Bitcoin price prediction for November 17 stays bearish below $70,000, the level $BTC needs to reclaim after dropping to the floor of its weekly triangle near $62,000.
Bitcoin Price Analysis: Can $BTC Reclaim $70,000?
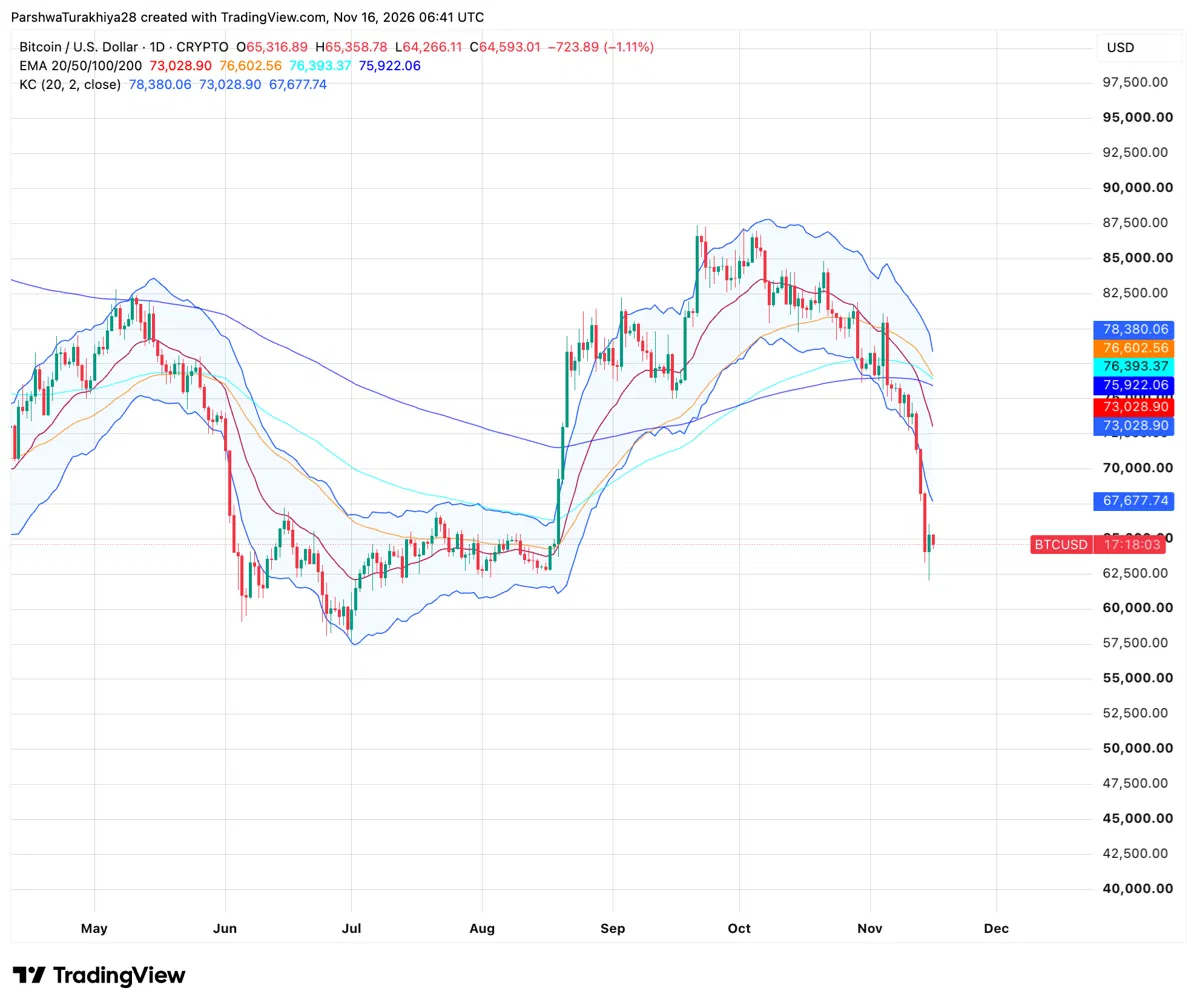
Bitcoin Price Analysis (Source: TradingView)
$BTC trades at $64,593, roughly 26% below its late-September high near $87,300, with former support at $70,000 now acting as resistance. Sunday’s drop reached $62,006 before buyers lifted price toward a close near $65,317, but that recovery has begun to fade.
Know when your coins move
Alerts, real-time prices, and market news — all in one app
Point your phone camera to install
4.8 based on 40K reviews in the App Store and Google Play
Bitcoin remains below all four daily moving averages. The nearest is the 20-day at $73,029, while the others sit between $75,922 and $76,603. Price also sits below the lower Keltner Channel boundary at $67,678, showing how sharply it has fallen beyond its recent trading range.
For November 17, $62,006-$67,678 looks like the more likely range. Recovering $67,678 would give buyers a chance to challenge $70,000, while a daily close below Sunday’s low could bring $60,000 into view.
Related: Cardano Price Prediction: Will ADA Reclaim $0.16 Amid the Hoskinson and Foundation Clash?
$BTC Support and Resistance Levels, November 17, 2026
Type
Price
Why it matters
Resistance
$65,000
Round level just above price
Resistance
$67,678
Lower Keltner Channel line
Resistance
$70,000
Round level, former support
Support
$64,266
Today’s low
Support
$62,006
Sunday’s low, at the weekly triangle floor
Support
$60,000
Round level
Bitcoin Weekly Chart: Can the Triangle Floor Hold?
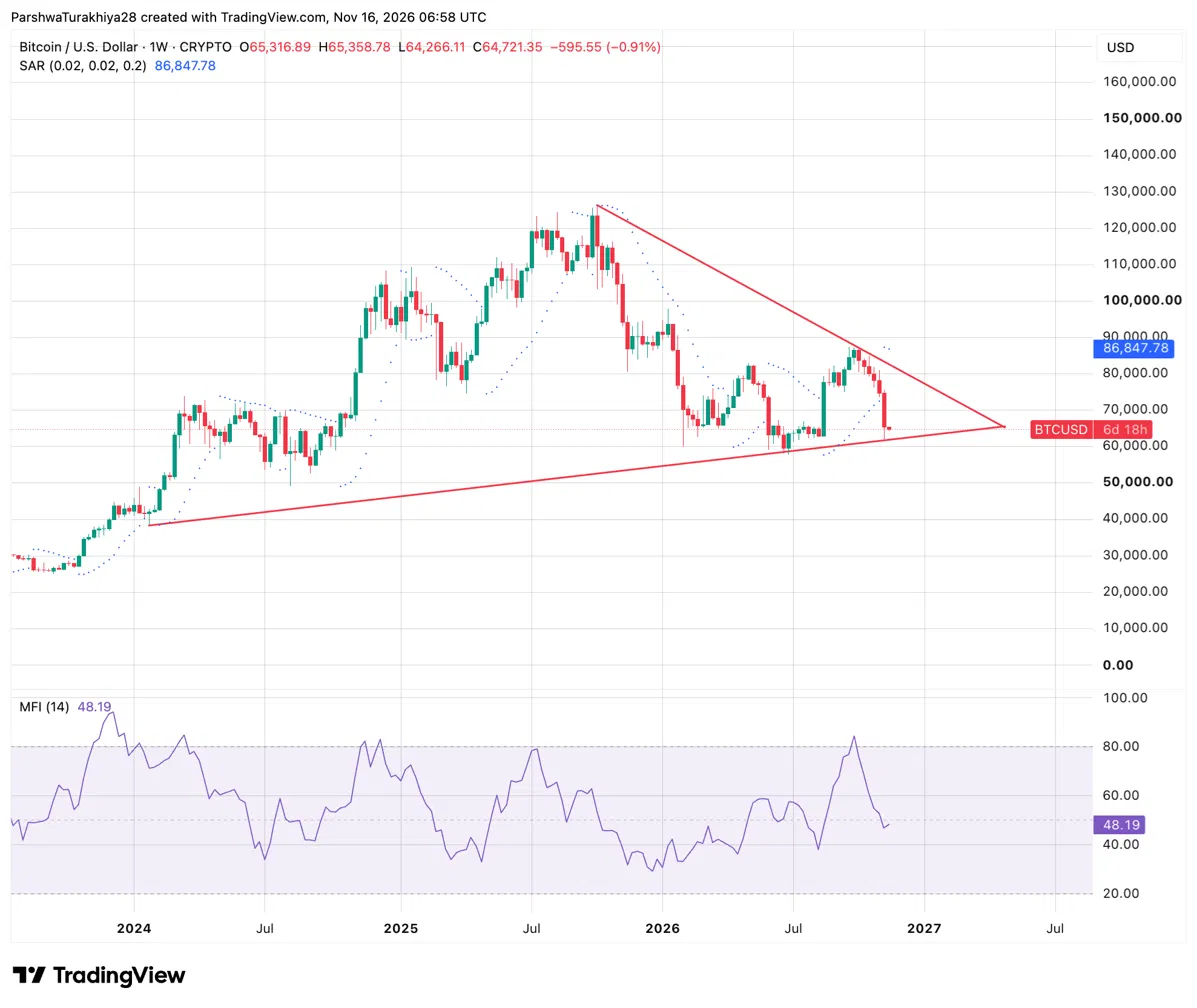
On the weekly chart $BTC has fallen to the rising line of a triangle that has squeezed price since early 2024. That line now runs near $62,000, and Sunday’s $62,006 low touched it and bounced. The falling upper line runs near $78,000, and the two meet near $65,000 in early 2027, so $BTC has to break out of the triangle one way within months.
The weekly Parabolic SAR at $86,847.78 sits far above price, so the weekly trend is still down. Weekly MFI, a volume-weighted momentum gauge, reads 48.19, near neutral, so it does not show the washed-out reading that usually marks a low. $BTC is about 4% above the floor, and a weekly close below it would put $58,000 in play.
Fear and Greed Falls to 19, Extreme Fear
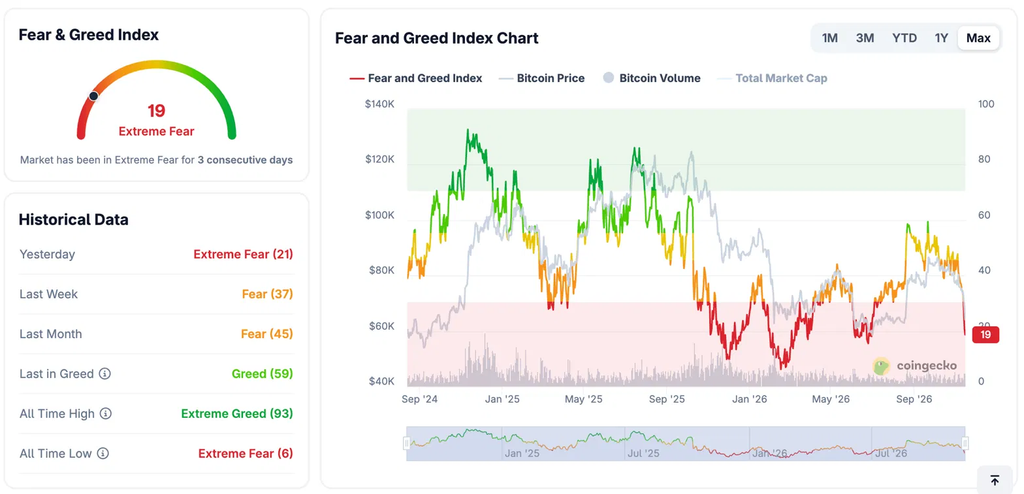
Bitcoin Fear and Greed Index (Source: CoinGecko)
CoinGecko’s Fear and Greed Index, which scores market mood from 0 to 100, reads 19, Extreme Fear, for the third straight day. It was 21 yesterday, 37 a week ago and 45 a month ago, a fall of 26 points in a month. The all-time low is 6.
Extreme fear can mark a bottom once sellers run out, but it can keep falling, as the low of 6 shows. Right now the index is still dropping while price sits on the weekly floor, so it does not yet show sellers giving up.
CZ Lists Five Possible Reasons for the Drop
Why are crypto prices down?
No one knows for sure. Correlation does not prove causation. Here are some potential reasons.
Money shifting to the Anthropic IPO: https://t.co/jYwVi4huAY
ETF outflows: U.S. spot Bitcoin ETFs saw about $1.9 billion in outflows over seven trading… pic.twitter.com/XL2aB1ZL9W
— CZ 🔶 BNB (@cz_binance) November 15, 2026
Binance co-founder CZ (@cz_binance) said on Sunday that no one knows for sure why crypto is falling and that correlation does not prove causation. He listed these possible reasons:
Money shifting to the Anthropic IPO
About $1.9B of US spot Bitcoin ETF outflows over seven trading sessions through November 13, with Ether funds also seeing withdrawals
Security fears after the Binance hack, drained iPhone-linked wallets, a Chrome exploit and a Microsoft outage
Hot US inflation raising expectations of another Fed rate hike, which means higher yields and a stronger dollar
Fears that the midterm results mean stricter US crypto policy
He added that Binance did not sell crypto and that he bought some in recent days, both his own claims.
Only the ETF outflow is a measured figure, and it comes secondhand from crypto.news. The IPO and policy points are guesses, so they give no level to trade around.
Peter Schiff Says Bitcoin Has No New Buyers
Why would Bitcoin stop falling? Where will the new buyers come from? The good news is in the past. Everyone who wanted to buy already has. AI didn't just steal Bitcoin's thunder; it's made it less secure as hacking odds keep rising. The Trump pump is over. Get ready for the dump.
— Peter Schiff (@PeterSchiff) November 14, 2026
Peter Schiff (@PeterSchiff), a long-time Bitcoin critic, said on November 14 that everyone who wanted to buy Bitcoin already has, so he asks where new buyers will come from.
He said AI has made Bitcoin less secure as hacking odds rise, and that the “Trump pump” is over. He expects a dump.
It is an opinion with no data behind it. His question about buyers does fit the ETF selling in CZ’s list, which is the only buyer data in this batch.
Bitcoin Price Prediction Scenarios for November 17
Bullish Case, Target: $67,678
$BTC holds Sunday’s low at $62,006, reclaims $65,000 and reaches the lower Keltner Channel line at $67,678, about 5% above today’s price. A close above it would open $70,000, about 8% higher. ETF outflows slowing and fear easing from 19 would fit this path.
$BTC closes below today’s low at $64,266 and then $62,006, about 4% below today’s price, which would put $60,000 in play, about 7% lower. A close below it would open $58,000, about 10% lower, near the early-summer low. More ETF outflows and another hot inflation reading would fit this path.
Related: $EVAA Protocol Price Prediction: $EVAA Protocol Rallies Toward $3 as Derivatives Interest Hits $43.90 Million
FAQs
What is the Bitcoin price prediction for November 17, 2026?
$BTC stays bearish below $70,000 and could move toward the lower Keltner Channel line at $67,678 if it holds $62,006 and reclaims $65,000. A daily close below $62,006 would put $60,000 in play.
Why is the Bitcoin price falling?
$BTC is about 26% below its late-September high near $87,300 and trades under all four daily EMAs. Binance’s CZ says no one knows for sure and lists about $1.9B of ETF outflows, hot inflation, security fears, the Anthropic IPO and midterm policy fears as possibilities, though none of the data ties the drop to a single cause.
Is Bitcoin in extreme fear?
CoinGecko’s Fear and Greed Index reads 19, Extreme Fear, for the third straight day, down from 45 a month ago. The all-time low is 6.
What is the key support level for Bitcoin?
$62,006, Sunday’s low and the weekly triangle floor, is the key support, with today’s low at $64,266 above it. A close below $62,006 would put $60,000 in play.

 coinedition.com