Bitcoin Repeats Rare Historical Signal: What It Means for the 4-Year Cycle
u.today
2 h
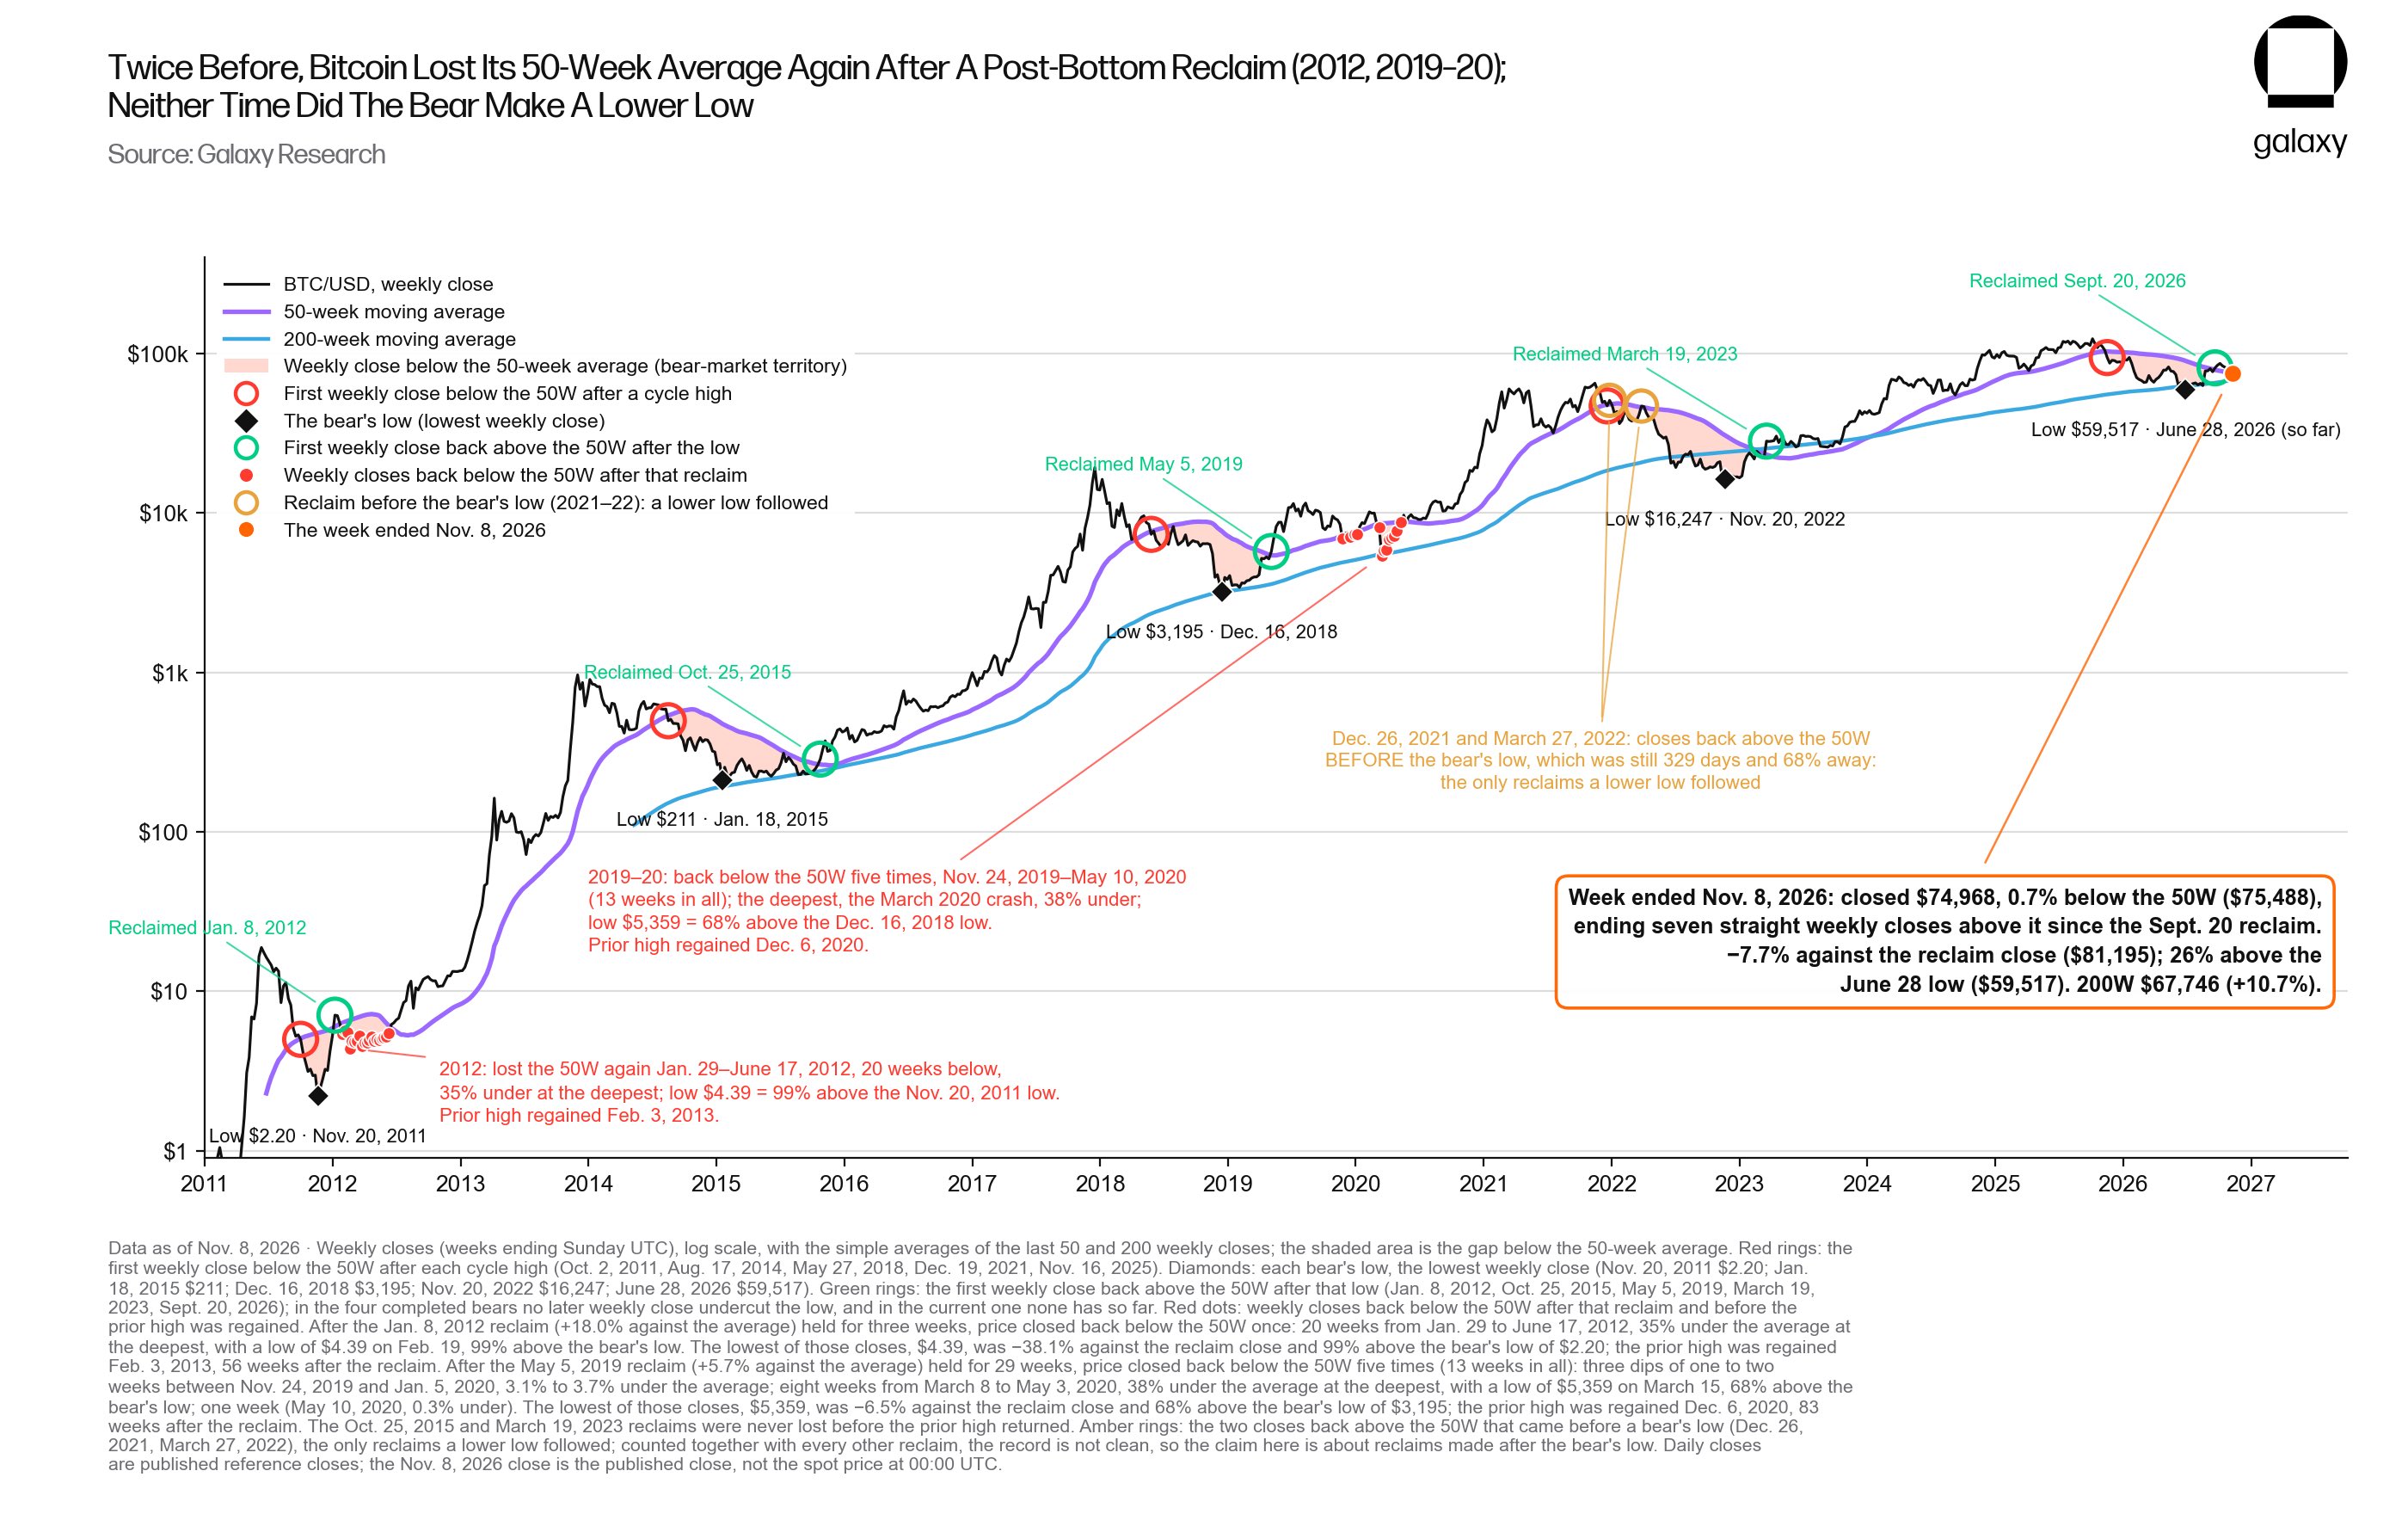
Bitcoin snapped a seven-week holding above the 50-week moving average (MA) with a weekly close at $74,968. According to the latest Galaxy Research report, BTC settled 0.7% under this key line, which now sits at $75,488.
Alex Thorn, the firm’s head of research, calls it a fakeout. The history is on his side: it's standard Bitcoin mechanics to slip back under the 50-week MA right after a bear-market bottom, and it's what shapes the structure of the four-year cycle. It has happened exactly twice before.
Neither time did the 4-year cycle break.
Know when your coins move
Alerts, real-time prices, and market news — all in one app
Point your phone camera to install
4.8 based on 40K reviews in the App Store and Google Play
What happened the last times Bitcoin tripped like this
Losing the trendline again right after reclaiming it is how the biggest cryptocurrency has always behaved. Previous cycles played out like this:
In the 2011–2012 cycle, after bottoming at $2.20, Bitcoin held above the average for seven weeks, then lost it and spent 20 weeks underneath. Price sank 35% below the MA, to $4.39 at peak panic. That level was still 99% above the absolute low, and a year later the market closed out the cycle with a fresh all-time high.
In the 2019–2020 cycle, after the $3,195 bottom, price dipped below the MA five times, for 13 weeks in total. The Covid crash in March dragged Bitcoin 38% under the average to a local low of $5,359. Global crisis and all, that low still sat 68% above the bottom. Less than nine months later, Bitcoin was printing new highs for its four-year run.
The current chart is running the same script. From the $123,524 peak in October 2025, the coin bled 51.8% into the June cycle bottom at $59,517. A rebound then shoved the price back above the 50-week MA at $81,195. Today’s price is 7.7% off that September reclaim level, yet Bitcoin maintains a comfortable 26% cushion above the June bottom.
Bitcoin 4-year cycle analysis and 50-week moving average deviations, Source: Galaxy Research
Thorn isn’t selling certainty. Two cycles is a thin sample, and bottoms only get confirmed in the rearview mirror. The margin for error is wide: in 2012, Bitcoin broke down again from 18% above the line, while in 2015 it held from just 8% above.
“Bitcoin just closed below its 50 week moving average after holding above it for 7 consecutive weeks. Two other times (2011-12 & 2019-20) btc closed below its 50w after reclaiming its post-bear bottom. Neither of those times did the bear make a new lower low (weekly close data),” the analyst notes.
One level kills the bull case for this 4-year cycle: $59,517. Galaxy Research says on-chain metrics, whale positioning and market sentiment all point to a consolidation that is technically ripe for stacking on spot. The technical case stays alive as long as Bitcoin reclaims the 50-week MA and holds it within the next month.

 u.today