The distinction matters because the timeframes disagree. The hourly structure remains bearish, but momentum on the 15-minute chart has turned positive. That makes this a potential mean-reversion bounce, not yet a confirmed trend reversal.
Liquidations and market fear frame the rebound
Bitcoin’s drop and rebound triggered $1 billion in liquidations, underscoring the violent nature of the move. Consequently, the distinction between an intraday recovery and a durable structural repair becomes particularly important.
CoinGecko puts total crypto market capitalization at $2.47 trillion, down 6.08% over 24 hours, with Bitcoin dominance at 60.20%. The broad contraction supports a defensive reading of the backdrop, although the dominance figure alone says nothing about the direction of capital flows.
Alternative.me’s Fear & Greed Index reads 29, classified as Fear. Sentiment therefore fits the weak technical backdrop, but it does not establish that a price floor is in place.
Bitcoin price remains below daily and hourly trend barriers
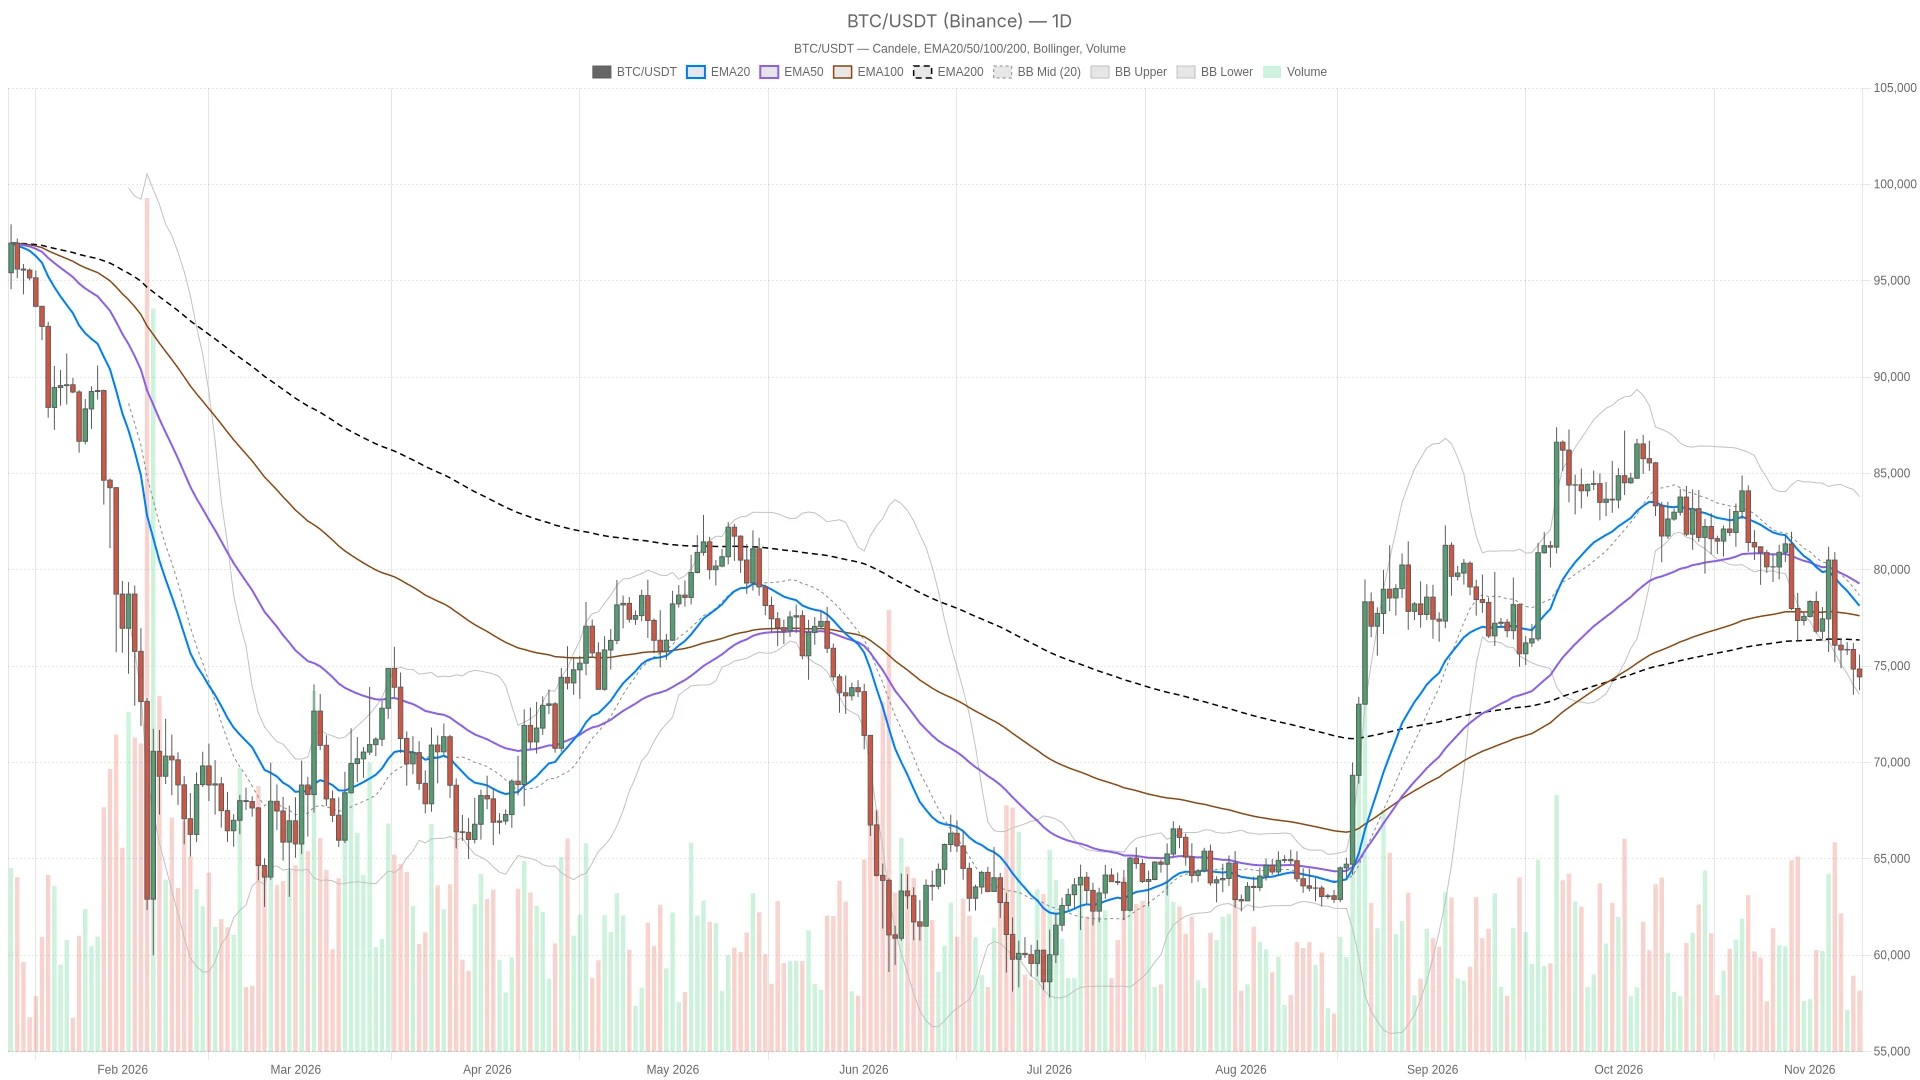
Bitcoin trades below all three daily moving averages and all three hourly moving averages, keeping the trend structure bearish across both timeframes. Binance-derived daily readings place it below the EMA20 at $78,516.35, EMA50 at $79,482.06 and EMA200 at $76,377.72. Those averages are not aligned in textbook bearish order, so the bearish case rests on price weakness rather than a fully ordered daily downtrend.
The hourly chart is more decisive: price is below the EMA20 at $75,044.04, EMA50 at $75,552.15 and EMA200 at $76,986.67, with the averages stacked bearishly. Moreover, this confirms that the rebound has not repaired the intermediate structure; the hourly EMA20 is the nearest moving-average resistance.
For execution context only, the 15-minute reading puts price at its EMA20, but below its EMA50 and EMA200. Those averages also retain a bearish ordering. The smaller chart is stabilizing locally without overturning the higher-timeframe bias.
Oversold hourly momentum conflicts with a positive 15-minute turn
Momentum readings diverge sharply across timeframes: the hourly chart is oversold while the 15-minute chart has turned positive. Daily RSI is falling at 35.6, while the negative daily MACD histogram is widening. Neither reading supports a daily momentum reversal: RSI is weak but not oversold, and the histogram shows downside momentum intensifying.
Hourly RSI has fallen to 28.2, an oversold reading, alongside a widening negative MACD histogram. The tension is important: an oversold market can rebound sharply, but the completed hourly readings still show deterioration rather than recovery.
The 15-minute chart offers the opposing evidence. RSI is rising at 46.2, and the MACD histogram has crossed into positive territory. This supports the immediate bounce, though RSI remains below its midpoint. The improvement is real at the execution timeframe, but it is not confirmation from the daily or hourly chart.
Daily Bollinger Bands put the lower boundary at $74,015.94, the midpoint at $79,094.74 and the upper boundary at $84,173.53. Price is near the lower edge and well below the midpoint, reinforcing the reading of a market under pressure rather than one trading around its central range.
The daily pivot separates a recovery attempt from renewed downside
The daily pivot at $74,853.81 is the boundary separating a recovery attempt from renewed downside, and Bitcoin remains below it. Beneath current price, the daily Bollinger lower boundary at $74,015.94 is the first daily support, followed by daily S1 at $73,507.63. These are the immediate boundaries for testing whether the rebound has substance.
On the hourly chart, price is already above hourly R1 at $74,249.34, so that level now sits underneath price as potential support—not as a pending breakout trigger. Meanwhile, the hourly pivot at $74,010.69 lies lower, followed by the hourly Bollinger lower boundary at $73,833.04 and hourly S1 at $73,631.36. The live reclaim of hourly R1 still needs completed-candle confirmation: the last completed hourly candle closed at $73,870.02.
Bullish scenario: a daily close above the daily pivot at $74,853.81 would establish the recovery trigger. It would open a test of daily R1 at $76,197.63, with the daily EMA200 at $76,377.72 beyond it. A subsequent daily close below the daily Bollinger lower boundary at $74,015.94 would invalidate that recovery setup.
Bearish scenario: a daily close below the daily Bollinger lower boundary at $74,015.94 would confirm a fresh downside break, putting daily S1 at $73,507.63 in focus. A subsequent daily close above the daily pivot at $74,853.81 would invalidate that breakdown setup.
Daily ATR is $2,293.88, compared with hourly ATR of $486.99 and 15-minute ATR of $291.58. Those readings make brief excursions through nearby levels less persuasive than completed closes. The likeliest false signal is a short-term bullish breakout that fails to carry through the daily pivot: positive 15-minute momentum alone cannot resolve the bearish higher-timeframe evidence.
FAQ
Is Bitcoin oversold across every timeframe?
No. The hourly RSI is oversold at 28.2, while the daily and 15-minute readings are not. The oversold label applies to the hourly chart, not to the entire setup.
Do the daily moving averages confirm a textbook bearish trend?
No. Price is below all three daily averages, but their ordering is mixed rather than stacked bearishly. The hourly averages provide the clearer bearish alignment.
Disclaimer: This article is for informational purposes only and does not constitute financial advice, an investment recommendation, or a solicitation to buy or sell any financial instrument or cryptocurrency. The analysis provided is not indicative of future results. Investing in crypto assets and financial markets carries a high risk of capital loss. Always do your own research (DYOR) and consult a qualified financial advisor before making any decision.
Article produced with the assistance of artificial intelligence and reviewed by the editorial team.

 en.cryptonomist.ch