Bitcoin Price Holds $80K, but Can Bulls Break $81,970 Resistance?
coinedition.com
19 m
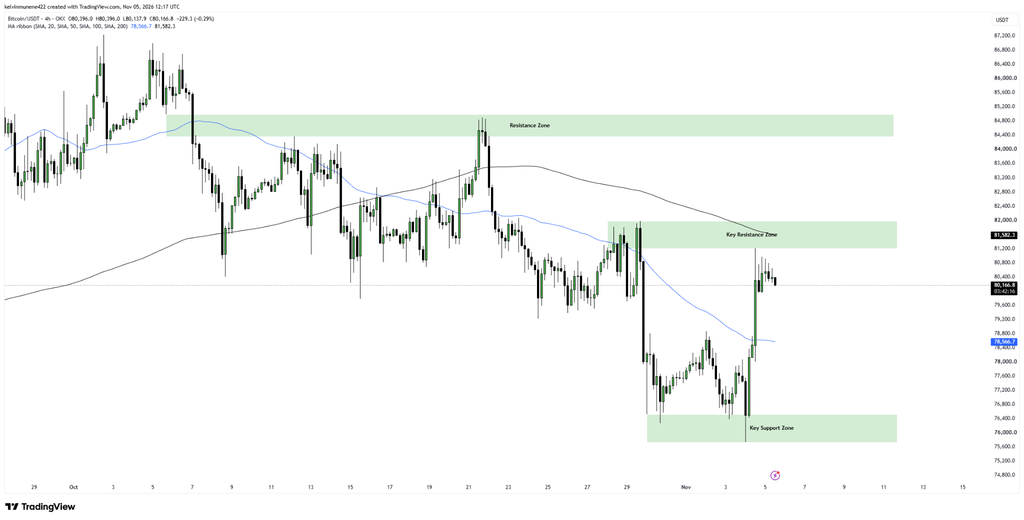
Bitcoin traded around $80,167 on November 5, recovering from support near $75,734–$76,519 but remaining below critical overhead resistance. The four-hour TradingView chart shows the $BTC price above its shorter moving average, while a longer average still caps the rebound.
Glassnode data suggest trading interest has held up during the pullback, although fresh demand remains uncertain. That leaves $81,200–$81,970 as the immediate test of whether Bitcoin’s recovery can extend.
Bitcoin Price Holds $80K as $81,970 Resistance Caps Recovery
The supplied $BTC/USDT chart, captured at approximately 12:17 UTC, placed Bitcoin at $80,166.8. Buyers had lifted the price from early-November lows before momentum slowed near $80,400. The blue 50-period moving average (MA) stood near $78,566.7, below the market price.
Know when your coins move
Alerts, real-time prices, and market news — all in one app
Point your phone camera to install
4.8 based on 40K reviews in the App Store and Google Play
Bitcoin therefore traded above its shorter-term trend reference, although that average continued sloping downward. However, the black 200-period MA remained higher at $81,582.3, inside the highlighted $81,200–$81,970 resistance zone.
Source: TradingView
A sustained four-hour close above $81,970 would indicate that buyers had cleared both horizontal resistance and the longer moving average. That would bring the next supply region around $84,350–$84,950 into view. Until then, the rebound remains vulnerable to selling near $81,600.
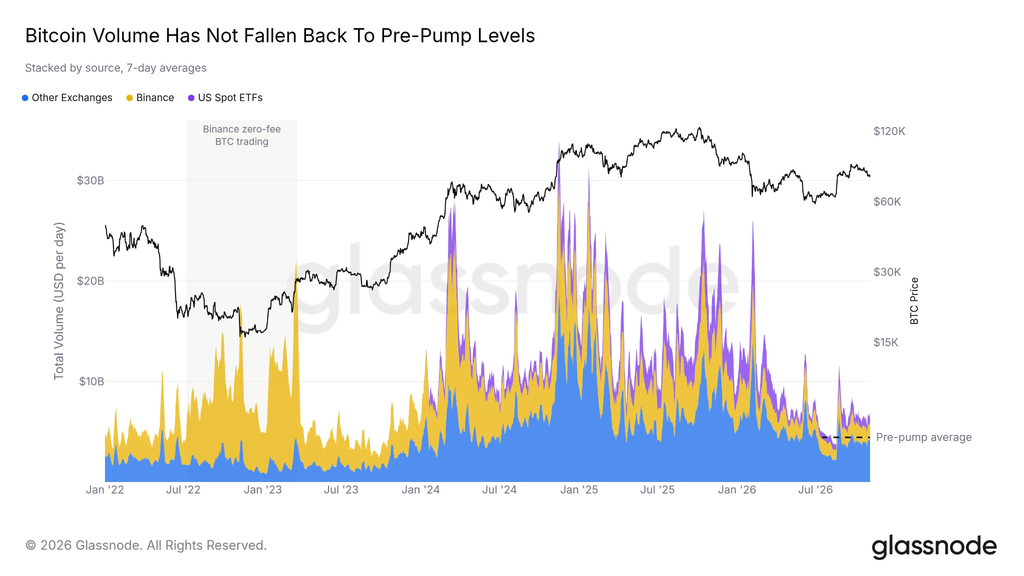
Glassnode reported on November 4 that seven-day average trading volume across spot exchanges and U.S. spot Bitcoin ETFs remained approximately 1.5 times its mid-July to mid-August baseline.
Activity declined after August’s breakout but stayed elevated through Bitcoin’s subsequent correction. However, higher turnover does not necessarily indicate stronger net buying. U.S. spot ETFs recorded nearly $1 billion in net outflows over two weeks through November 2, including $640 million that day.
Source: X
Meanwhile, ETF trading averaged approximately $1.3 billion daily since May, indicating limited fresh institutional demand. Glassnode further reported only 38% of short-term holder supply in profit, compared with at least 97.5% in early October.
Follow us onXfor real-time crypto updates.
Bitcoin’s $78,567 Average and $75,734–$76,519 Support Remains Crucial
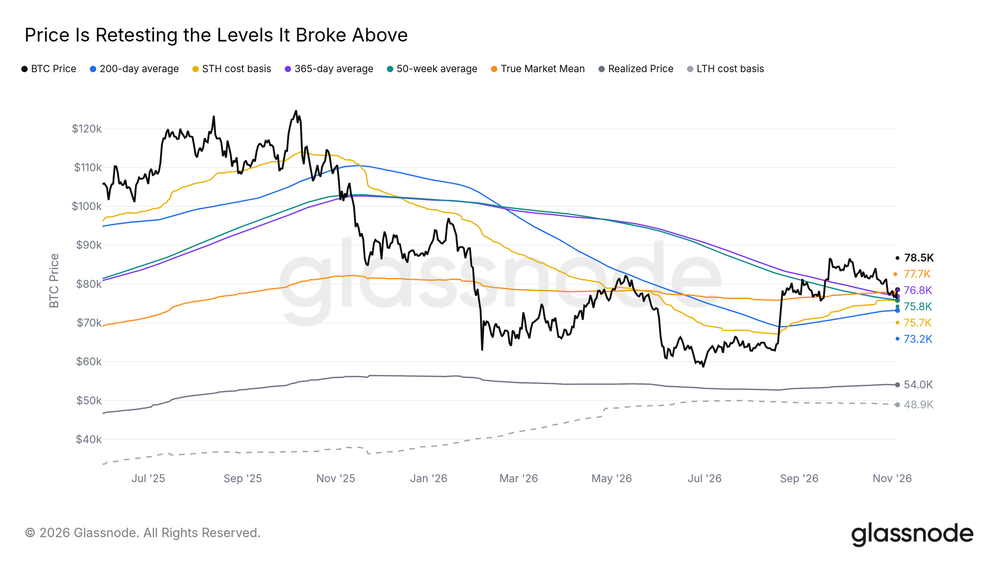
If Bitcoin slips below $80,000, the 50-period SMA around $78,567 becomes the first moving-average support to watch. Glassnode’s True Market Mean near $77,700 provides another reference. Below that, the TradingView chart marks stronger support between $75,734 and $76,519.
Source: Glassnode
Glassnode separately places the short-term holder cost basis around $75,700. A sustained break beneath this cluster would weaken the recovery. Conversely, holding $78,567 while challenging $81,970 would keep the higher resistance zone in focus.
Key Bitcoin Support and Resistance Levels
Level
Technical Significance
$84,350–$84,950
Higher resistance and bullish target
81,200–81,970
Immediate resistance and breakout zone
$80,000
Psychological support
$78,566.7
50-period MA support
$77,700
Glassnode True Market Mean
$75,734–$76,519
Major support zone
Bullish Case
A sustained four-hour close above $81,970 could open a recovery toward $84,350–$84,950.
Bearish Case
Meanwhile, losing $78,567 could expose $77,700, followed by $75,734-$76,519 support.
FAQs
1. What Is Bitcoin’s Immediate Resistance?
Bitcoin faces immediate resistance between $81,200 and $81,970, where sellers could challenge further upward price movement.
2. What Is Bitcoin’s Next Bullish Target?
Bitcoin’s next bullish target lies between $84,350 and $84,950 if buyers successfully break above immediate resistance.
3. Where Is Bitcoin’s Strongest Support?
Bitcoin’s strongest identified support zone lies between $75,734 and $76,519, where renewed buying interest could emerge.
4. Is Bitcoin Trading Volume Recovering?
Glassnode reports Bitcoin trading volume remains 1.5 times its pre-August baseline, despite activity declining after August’s breakout.
Subscribe to our YouTube channel for the latest crypto news.
Related: TRUMP, WLFI, and MELANIA Tokens Plunge as $BTC and ETH Rally: Is Capital Leaving Political Meme Coins?

 coinedition.com