Bitcoin Rainbow Chart says BTC will hit this price on December 31, 2026
finbold.com
18 h
Bitcoin ($BTC) could climb towards $94,212 by December 31, 2026, according to projections from the Bitcoin Rainbow Chart.
The $BTC price prediction comes as Bitcoin trades at $77,316 as of press time, leaving the cryptocurrency 21% below the projected year-end level in the ‘BUY’ band.
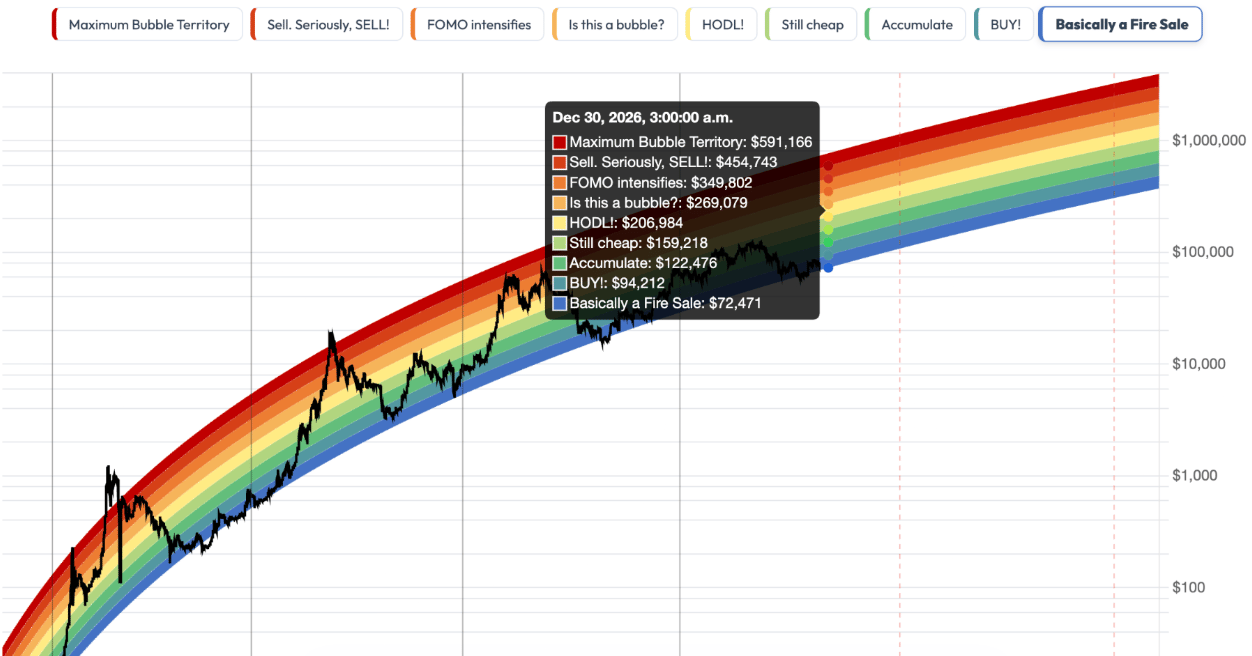
To this end, data from BlockchainCenter’s Bitcoin Rainbow Chart outlines nine potential valuation zones for the end of December 2026, with prices ranging from $72,471 in the lowest band to $591,166 in the highest.
Know when your coins move
Alerts, real-time prices, and market news — all in one app
Point your phone camera to install
4.8 based on 40K reviews in the App Store and Google Play
The bottom ‘Basically a Fire Sale’ band places Bitcoin at $72,471, while the ‘BUY’ band indicates $94,212. The green ‘Accumulate’ band projects a price of $122,476, followed by ‘Still Cheap’ at $159,218.
Bitcoin Rainbow Chart. Source: Blockchain Center
Bitcoin’s potential massive rally
Moving higher, the ‘HODL’ band places Bitcoin at $206,984, while the ‘Is This a Bubble?’ zone indicates $269,079.
The ‘FOMO Intensifies’ zone projects $349,802, followed by the red ‘Sell. Seriously, SELL!’ zone at $454,743. At the top, ‘Maximum Bubble Territory’ indicates a valuation of $591,166.
It’s worth noting that the Rainbow Chart is a historical valuation model, not a precise forecasting tool, and its projections do not guarantee Bitcoin’s year-end price.
Key Bitcoin price levels to watch
As things stand, Bitcoin’s immediate outlook remains uncertain in the wake of the $6.3 billion Binance hack, with analysts identifying $76,000 as a critical support level.
A breakdown could expose the $73,000 to $75,000 region, while reclaiming $82,000 could open the way towards $85,000 to $87,000.
Meanwhile, Coinbase Institutional has also highlighted the $80,000 to $82,000 region as an important price zone, citing its overlap with the Bitcoin ETF holders’ cost basis and the 50-day moving average (MA).
Bitcoin end of Q4 returns
Meanwhile, Bitcoin’s historical year-end performance highlights the cryptocurrency’s volatility. It recorded a massive rally in 2020, gaining more than 300%, before extending its advance in 2021 with an annual return of approximately 59%.
However, the cryptocurrency suffered a steep reversal in 2022, losing more than 64% of its value. Bitcoin subsequently rebounded with gains of approximately 156% in 2023 and 121% in 2024, before retreating by around 6% in 2025.
The mixed performance illustrates how dramatically Bitcoin’s annual returns can vary, making historical trends an unreliable predictor of its remaining performance in 2026.

 finbold.com