Bitcoin Price Tests $76,850 Support as US Midterm Odds Favor Democrats
coinedition.com
03 November 2026 13:10, UTC
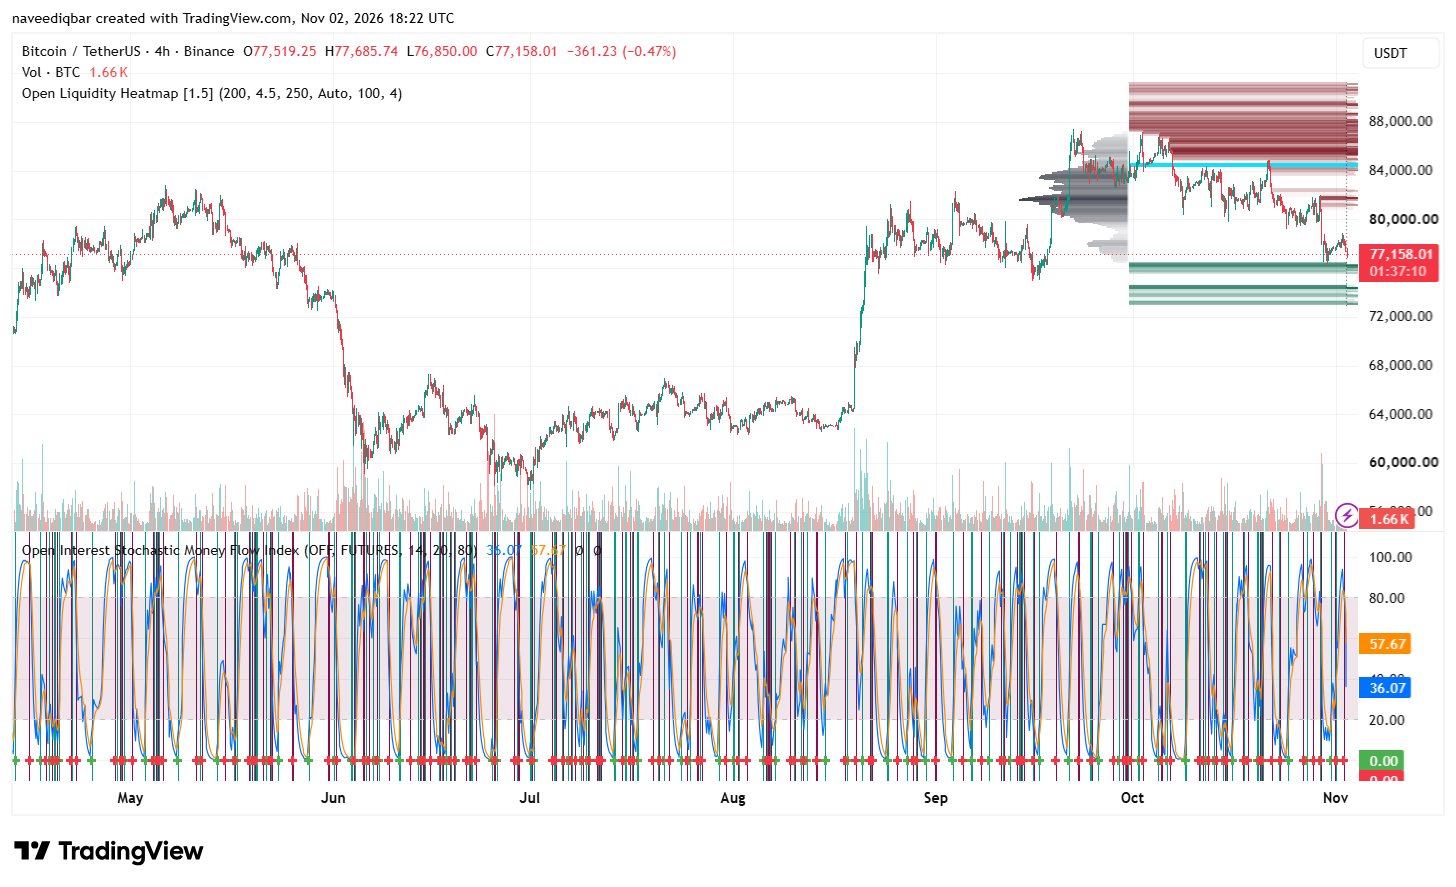
Bitcoin is caught between a fragile $76,850 support test and overhead liquidity stacked above $82,000 as U.S. voters prepare to elect a new Congress. The four-hour chart shows $BTC struggling to regain its October highs, while prediction markets favor a Democratic sweep ahead of the November 3 midterms.
Bitcoin traded at $77,158.01, down 0.47% at press time. The price had ranged between $76,850 and $77,685.74. Its recent decline has left the market testing nearby support rather than confirming a sustained recovery.
Indicator
Reading
$BTC/USDT displayed price
$77,158.01
Latest candle low
$76,850
First recovery threshold
$80,000
Near-term overhead liquidity
$81,500-$82,000
Deeper overhead liquidity
$83,500-$84,500
Polymarket Democratic sweep odds
72%
Know when your coins move
Alerts, real-time prices, and market news — all in one app
Point your phone camera to install
4.8 based on 40K reviews in the App Store and Google Play
Bitcoin Price Analysis Puts $76,850 Support Under Pressure
The four-hour chart shows Bitcoin retreating from a September–October swing high around $86,000-$87,000. Subsequent rebounds failed to recover those highs, and $BTC moved lower through October toward the $80,000 area before falling further. This sequence of lower highs keeps the short-term structure tilted to the downside.
Source: TradingView
The latest candle’s $76,850 low is the first level to monitor. A four-hour close below that area would provide stronger evidence that sellers are extending the decline. The liquidity heatmap then points to a potential support area around$75,000-$76,000, followed by another cluster near $73,000-$74,000. These zones indicate where liquidity may be concentrated, not guaranteed price destinations.
The lower indicator panel offers no clear reversal confirmation. Its displayed blue and orange readings stand at 36.07 and 57.67, respectively, within the indicator’s 20–80 range. Neither reading is at an extreme, so the panel does not independently establish that $BTC is oversold or ready for a strong rebound.
Follow us onXfor real-time crypto updates.
Bitcoin Price Analysis Maps Overhead Liquidity Near $82,000
A recovery would first need to reclaim $80,000, a psychological level that sits above the current price and near recent trading activity. Holding above it would improve the short-term setup, but buyers would still face liquidity around $81,500-$82,000.
Beyond that zone, the heatmap shows a more substantial concentration around $83,500-$84,500, followed by denser overhead liquidity extending from roughly $86,000 toward $90,000. These areas could become relevant if buying pressure returns, although liquidity clusters alone do not establish that price will reach them.
The more convincing bullish signal would be a sequence of four-hour closes above $80,000 and then $82,000, supported by stronger momentum. If $BTC repeatedly fails to reclaim the first threshold, rebounds may remain corrective within the broader October decline.
US Midterm Odds Favor Democrats as Market Risks Remain in Play
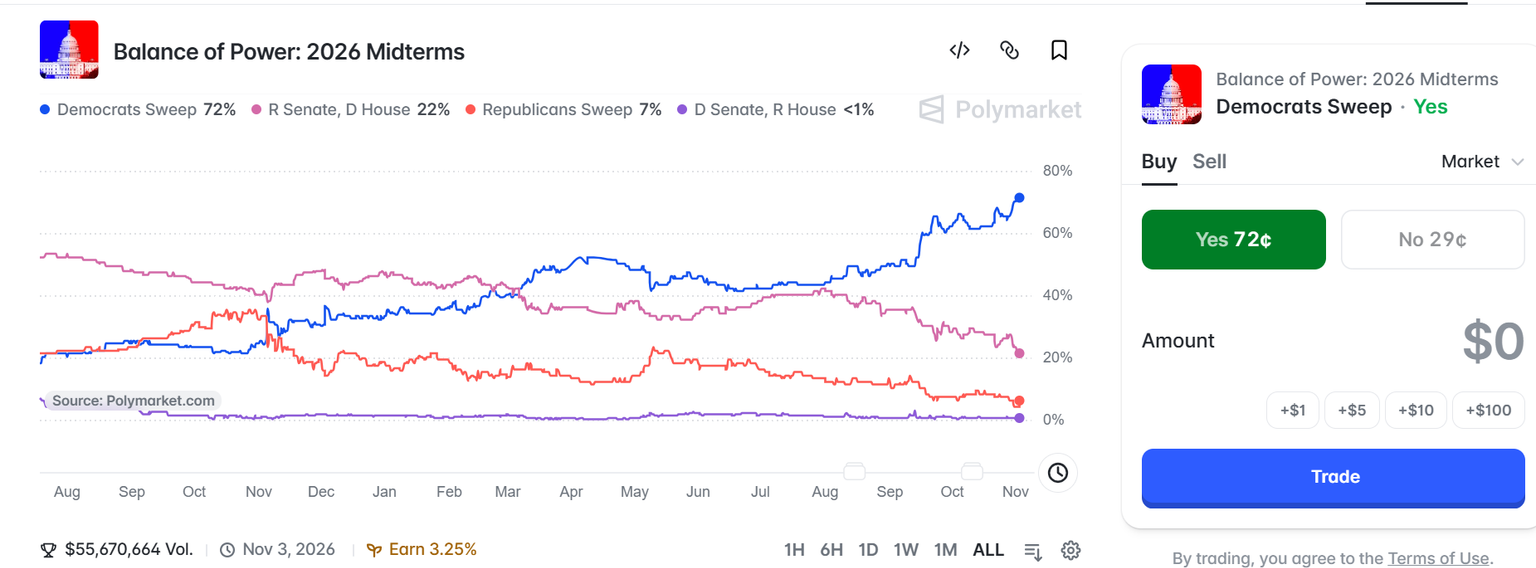
Polymarket midterm market showed a 72% probability of a Democratic sweep, 22% for a Republican Senate and Democratic House, and 7% for a Republican sweep. The market displayed about $55.67 million in total volume.
Source: Polymarket
Congressional control could influence the direction of U.S. cryptocurrency regulation, particularly through legislation and oversight. A Democratic sweep could bring different regulatory priorities than a Republican-controlled Congress, potentially affecting the outlook for the digital asset industry. However, the 72% prediction market probability reflects current election expectations, not a confirmed outcome.
Key Bitcoin Price Levels
Price Level
Technical Significance
$86,000-$90,000
Larger overhead liquidity area
$83,500-$84,500
Major overhead liquidity cluster
$81,500-$82,000
Near-term overhead liquidity
$80,000
Psychological recovery threshold
$76,850
Latest displayed candle low
$75,000-$76,000
Potential next support zone
$73,000-$74,000
Deeper liquidity zone
Bullish Case
If $BTC holds above $76,850 and reclaims $80,000, buyers could test the $81,500-$82,000 liquidity area. A sustained move through that zone would put $83,500-$84,500 in focus.
Bearish Case
A confirmed four-hour close below $76,850 would weaken the near-term setup and expose the $75,000-$76,000 area. If that zone fails to hold, the next heatmap cluster sits around $73,000-$74,000.
FAQs
Why is $76,850 important for Bitcoin?
It marks the low of the latest displayed four-hour candle. A confirmed break below it would put lower liquidity zones in focus.
What does the Bitcoin liquidity heatmap show?
It shows potential liquidity concentrations below the current price around $75,000-$76,000 and $73,000-$74,000, with larger clusters overhead from roughly $82,000 upward.
Does a 72% Democratic sweep probability mean Bitcoin will fall?
No. Polymarket odds reflect traders’ expectations for the election, not a forecast of Bitcoin’s price. The chart does not establish a direct link between the two.
What would strengthen Bitcoin’s recovery?
$BTC would need to hold nearby support, reclaim $80,000, and then sustain a move above the $81,500-$82,000 area. Those levels remain conditional reference points, not guaranteed targets.
Subscribe to our YouTube channel for the latest crypto news.
Related: Is Bitcoin Heading for a Major Bottom After the November 2026 Elections?

 coinedition.com