US stocks opened lower as AI-sector expenditure woes coincided with a surge in oil prices on the back of tensions around the US-Iran war.
The S&P 500 and tech-heavy Nasdaq Composite Index were down 0.6% and 0.2%, respectively, at the time of writing. The Dow Jones Industrial Average was 1.4% lower.
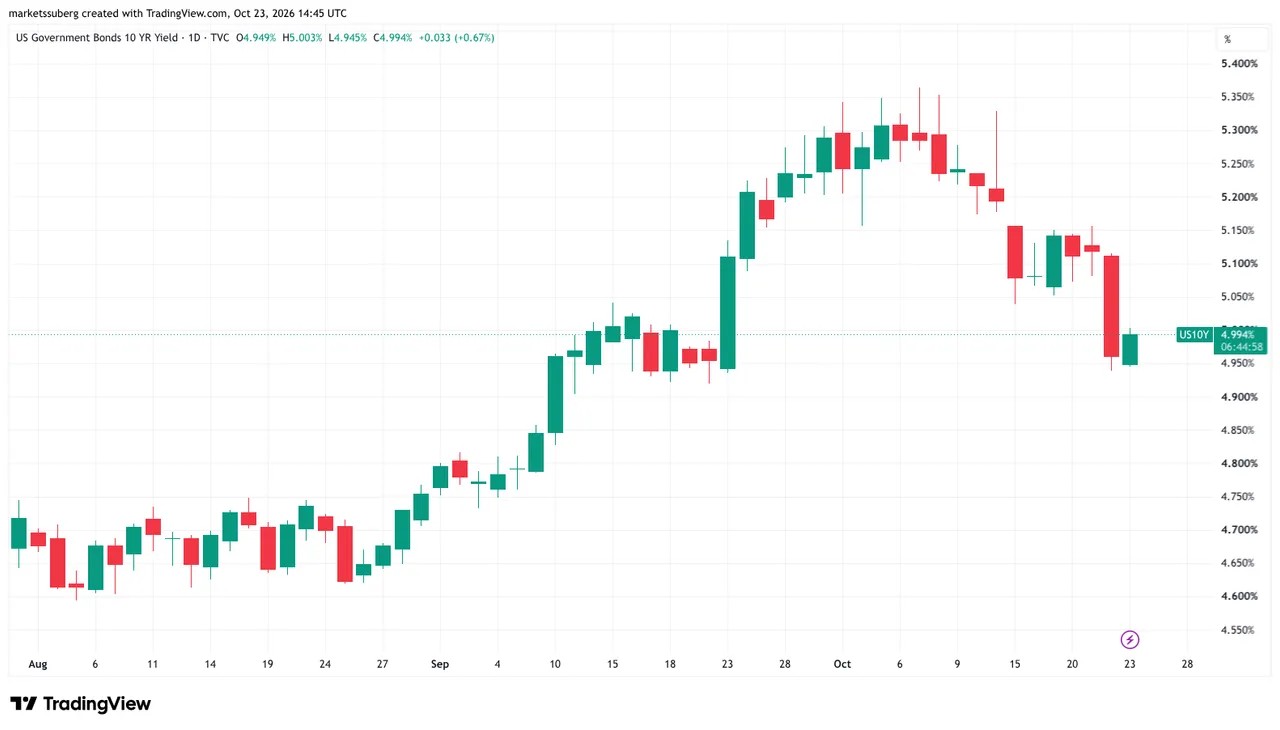
As traders turned risk-averse, the 10-year US bond yield stayed below 5%, having reached 4.939% on Thursday, their lowest since Sept. 23.
US 10-year bond yield one-day chart. Source: Cointelegraph/TradingView
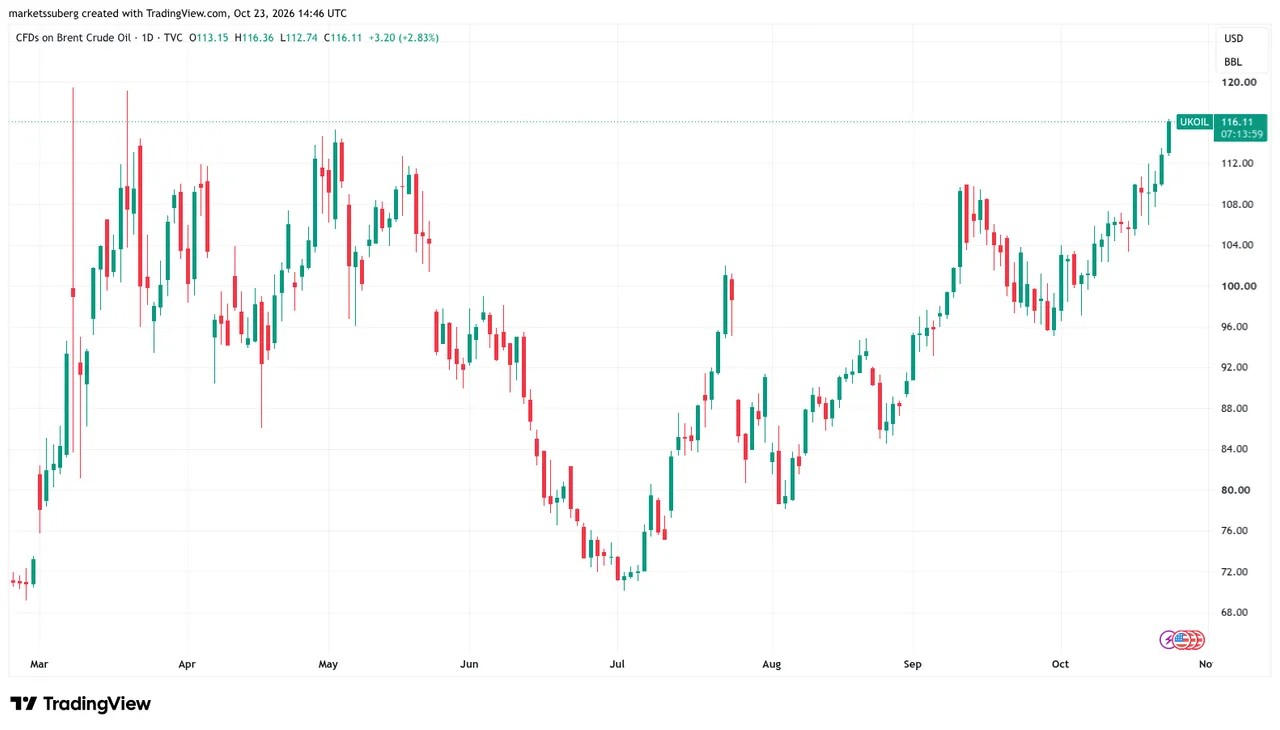
Concerns that the US may renew military strikes on Iran around the midterm elections sent WTI crude oil past $102 per barrel on Friday. This is the highest level since Sept. 16. Brent crude saw an even sharper rise of nearly 3% to $116 per barrel, a level last seen in mid-March.
CFDs on Brent crude oil one-day chart. Source: Cointelegraph/TradingView
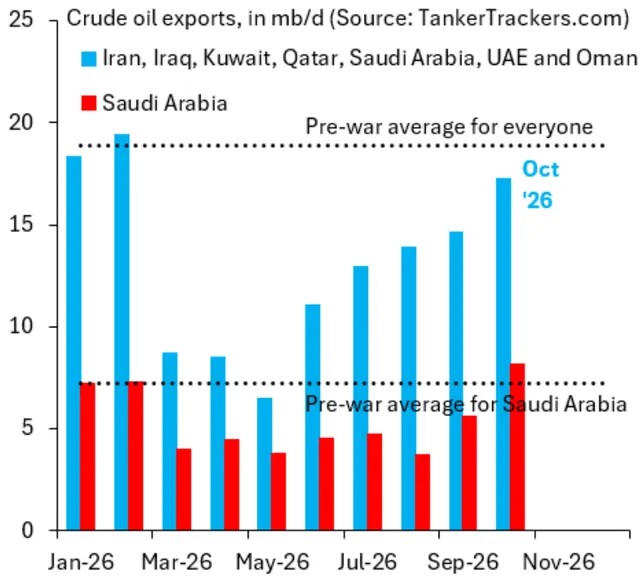
Commenting, economist Robin Brooks noted that prices were rising although oil flows through the Persian Gulf approached pre-war levels for many nations and Saudi Arabia surpassed its pre-war average.
“Since the start of the war, we’ve not seen this kind of decoupling between prices and flows,” he wrote in analysis on the day, seeing markets incorporating a “huge risk premium.”
Persian Gulf oil-transit volumes (screenshot). Source: Robin Brooks on Substack.com
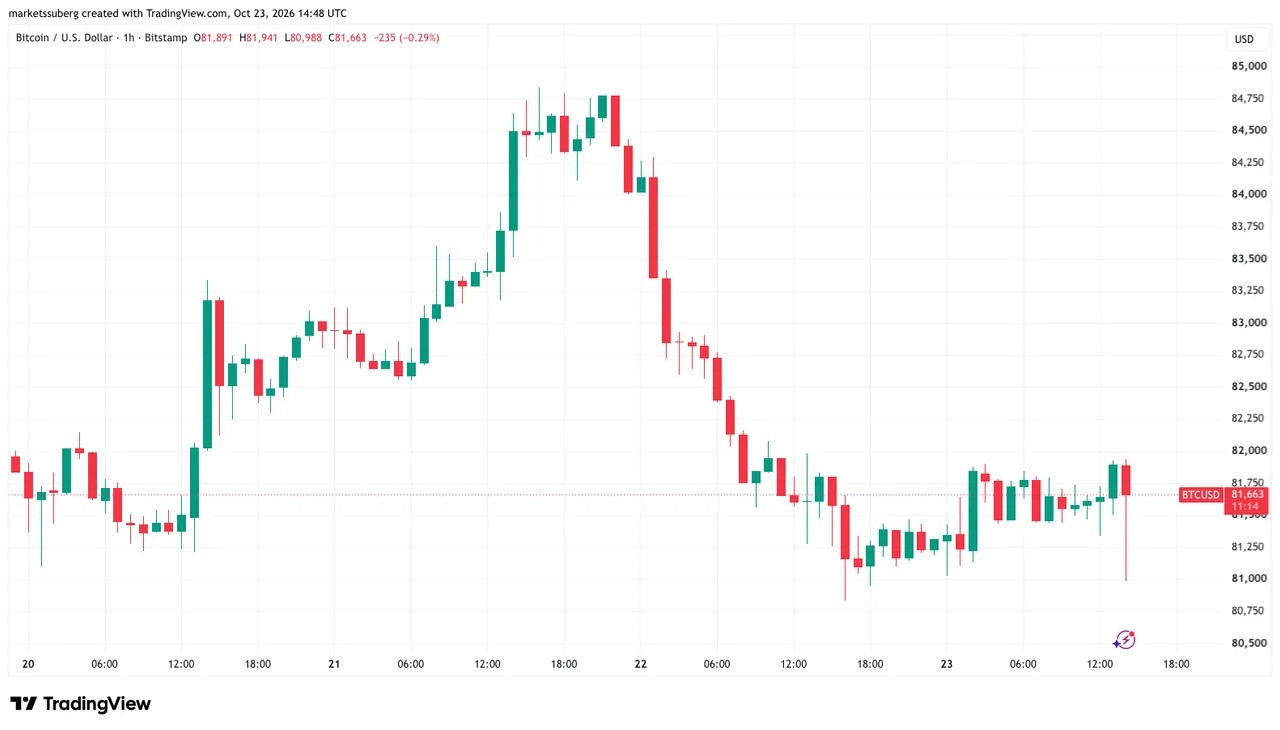
$BTC price analysis eyes 50-day trend line
Commenting on low-timeframe $BTC price action, Keith Alan, cofounder of crypto trading platform Material Indicators, saw the potential for lower support retests to come.
Related: Here’s what happened in crypto today
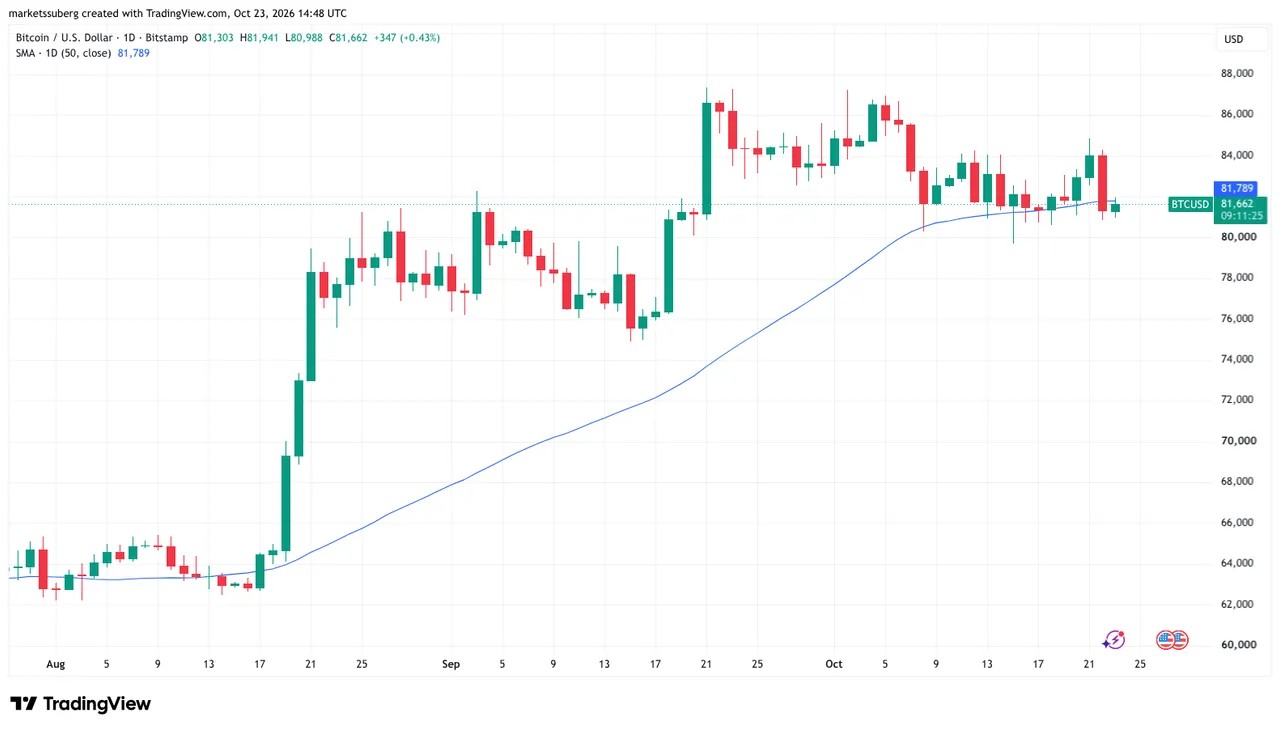
$BTC/USD, he noted, had fallen below its 50-day simple moving average (SMA) at $81,781, with bulls now attempting to reclaim it by the daily close.
“If they fail to do so by tonight’s close, I’m looking for a support test in the $78k - $80k range,” he told X followers.
$BTC/USD one-day chart with 50 SMA. Source: Cointelegraph/TradingView
Previously, Cointelegraph reported on substantial $BTC price support between $80,000 and $81,500, as this area hosts the aggregate cost basis for investors in the spot Bitcoin exchange-traded funds (ETFs).

 cointelegraph.com