Bitcoin Rainbow Chart predicts BTC price for October 31, 2026
finbold.com
03 October 2026 22:08, UTC
Bitcoin’s ($BTC) long-term valuation model, the Bitcoin Rainbow Chart, is suggesting that the cryptocurrency remains below its historical trend valuation as October begins.
The outlook comes as Bitcoin failed to reclaim the $90,000 level, a move that could have opened the door to a push toward six-figure valuations.
At press time, Bitcoin was trading at $84,584, while remaining above its 50-day SMA of $78,136 and 200-day SMA of $71,404, indicating the broader uptrend remains intact.
Know when your coins move
Alerts, real-time prices, and market news — all in one app
4.8 based on 40K reviews in the App Store and Google Play
Although the Rainbow Chart’s October 31 valuation bands sit well above Bitcoin’s current price, the indicator is designed to gauge long-term valuation rather than forecast where $BTC will trade by month-end.
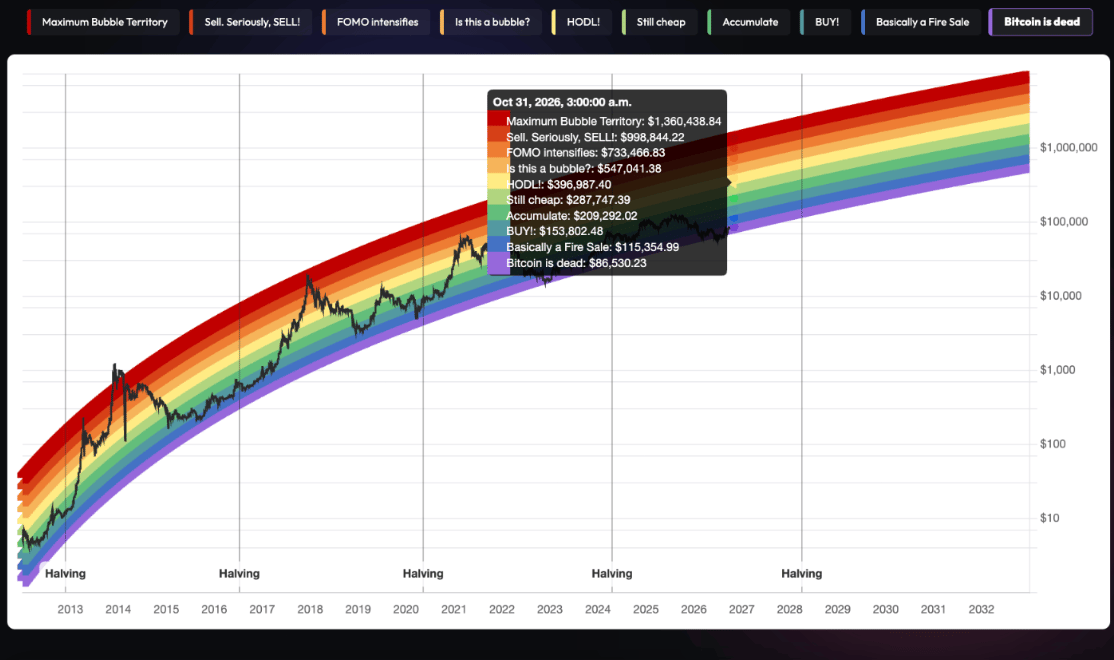
According to the chart, the highest valuation zone on October 31 is ‘Maximum Bubble Territory’ at $1.36 million, a band historically associated with extreme market euphoria and cycle tops.
Bitcoin Rainbow chart. Source: Blockchain Center
Below it sits ‘Sell. Seriously, SELL!’ at $998,844, a zone linked to historically stretched valuations and heightened profit-taking. The ‘FOMO Intensifies’ band stands at $733,467, representing periods when speculative demand accelerates.
Next is ‘Is this a bubble?’ at $547,041, followed by ‘HODL!’ at $396,987, a region generally considered fair value. The ‘Still cheap’ band sits at $287,747, while ‘Accumulate’ is positioned at $209,292, both indicating undervaluation relative to Bitcoin’s long-term trend.
The ‘BUY!’ band stands at $153,802, representing significant undervaluation, while the lowest band, ‘Basically a Fire Sale,’ is located at $115,355, a zone historically associated with deep discounts and extreme market pessimism.
With Bitcoin currently trading at $84,584, the cryptocurrency remains below the chart’s lowest valuation band, highlighting the gap between current market prices and the model’s long-term trajectory.
Bitcoin short-term outlook
While the Rainbow Chart focuses on long-term valuation, crypto analyst Ali Martinez is watching a much nearer-term price level.
According to Martinez in an X post on October 3, Bitcoin’s recent rally toward $87,000 stalled after whales reportedly took profits on more than 30,000 $BTC. The $87,000 region also coincided with the upper boundary of a trading channel that has capped prices for more than two weeks.
BITCOIN: NEW BUYING OPPORTUNITY
Bitcoin’s recent surge toward $87,000 was compromised before it even got going.
Not only were whales taking profits on the way up, selling more than 30,000 $BTC, but $87,000 also marked the top of the channel that has rejected Bitcoin for more… https://t.co/C1Szjow1Df pic.twitter.com/hNG1p6dbym
— Ali Charts (@alicharts) October 3, 2026
Following the rejection, Martinez identified $82,500 as the immediate downside target. The analyst argued that if Bitcoin falls to that level and whale accumulation resumes, it could provide confirmation for another rebound attempt toward $87,000.

 finbold.com