4-Hour Chart: The $85,600 Breakout Gets the Ax
Pull the lens back to four hours and the failed breakout becomes harder to miss. Bitcoin ripped to $85,600 during the Sept. 30 12 p.m. UTC candle on 839 $BTC, the heaviest four-hour volume in the observed window, but closed considerably lower at $84,077. Later candles couldn’t hold above roughly $84,400, and the Oct. 1 4 a.m. candle reached $84,357.92 before closing at $83,380.
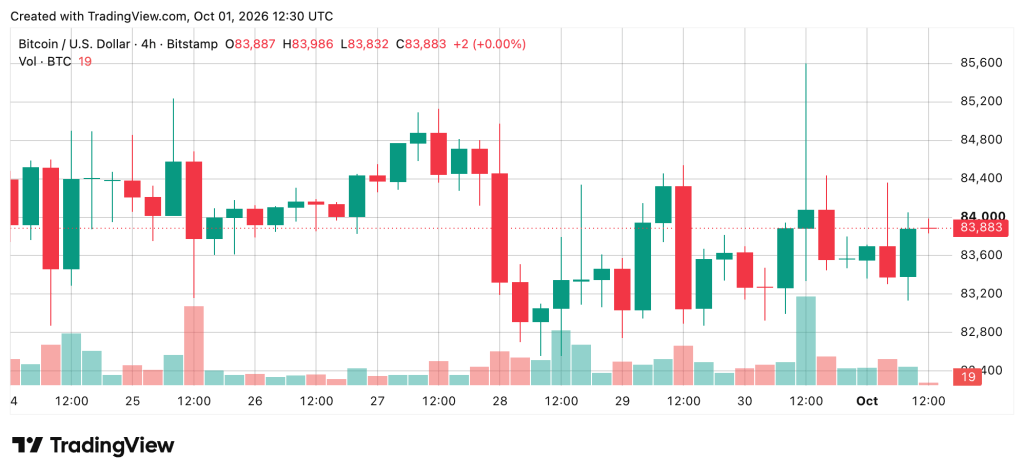
The subsequent candle wicked to $83,130.14 and recovered toward $83,882. The result is a market back in the middle of its 83,100-to-84,400 range, with reactive demand at $83,130 to $83,300 and supply waiting at $84,300 to $84,400, followed by $85,600.
Daily Chart: Bitcoin’s Two-Week Shelf Holds
The daily chart paints a broader picture of consolidation rather than continued trend expansion. After bitcoin reached $87,373.64 on Sept. 21, trading from Sept. 24 through Sept. 30 remained largely confined between $82,555 and $85,600.
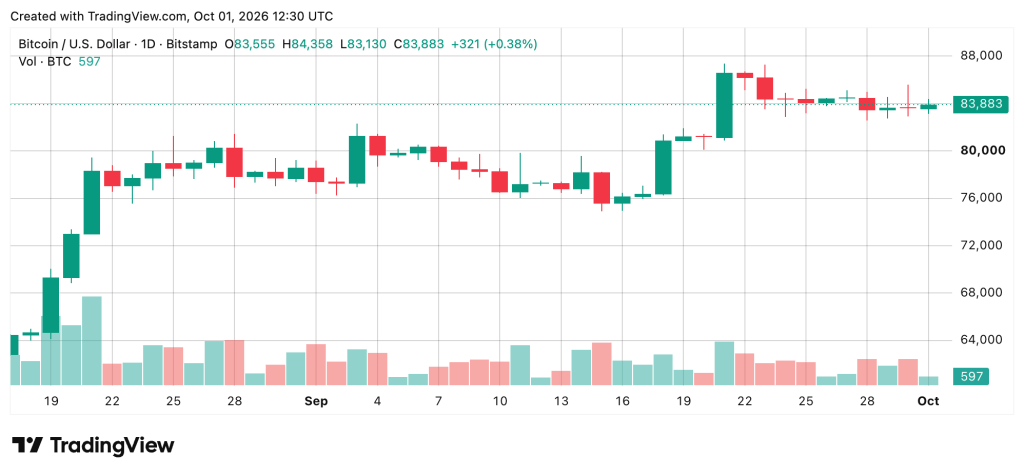
Buyers have repeatedly stepped in around the low-$83,000s, while sellers have kept advances contained between $85,100 and $85,600. On Oct. 1, bitcoin opened at $83,555.46, climbed to $84,357.92, slipped to $83,130.14 and was last trading near $83,900. That leaves two clear lines in the sand, with a daily close above $85,600 reopening a path toward the Sept. 21 high near $87,374, while a close below $82,555 would crack the two-week trading shelf.
Oscillators Throw Cold Water on the ‘Bullish’ Reading
The oscillator desk isn’t confirming the bullish moving-average setup. The relative strength index (RSI) (14) stands at 63, stochastic at 69, commodity channel index (CCI) at 51, and average directional index (ADX) (14) at 41, all neutral.
The Awesome oscillator is neutral at 3,714, while momentum (10) at -2,343 and moving average convergence divergence (MACD) (12, 26) at 2,008 both register sell signals. Stochastic relative strength index fast reads 36, Williams sits at -28, bull bear power is 1,286 and the Ultimate oscillator is 51, with all four neutral. The oscillator tape counts nine neutral readings, two bearish ones, and zero bullish signals.
Moving Averages Hold the Cards
Moving averages (MAs) tell almost the opposite story, with 13 bullish readings, one neutral and one bearish signal. The 10-period exponential moving average (EMA) sits at $83,549, while the 10-period simple moving average (SMA) at $84,285 is the lone sell. The 20-, 30-, 50-, 100- and 200-period exponential moving averages (EMAs) and simple moving averages (SMAs) all register buys, ranging from $70,510 to $82,175.
The Ichimoku baseline is neutral at $81,144, while the 20-period volume weighted moving average (VWMA) at $81,607 and 9-period hull moving average (HMA) at $83,548 register buys. Bitcoin is above every listed moving average except the 10-period SMA. For now, the technical “Buy” is real, but it’s a moving-average story inside a market that remains range-bound until $85,600 or $82,555 gives way on a daily close.
Bull Verdict:
Buyers remain in the driver’s seat above the $83,000 area, with 13 moving averages flashing bullish signals. A clean break through $84,360 would strengthen the short-term setup, while a daily close above $85,600 would put the Sept. 21 high near $87,374 back on the board.
Bear Verdict:
Momentum remains the weak link, with zero bullish signals from oscillators and both momentum and moving average convergence divergence (MACD) registering negative readings. A break below $83,130 would pressure the current bounce, while a daily close beneath $82,555 would crack the two-week trading shelf and weaken the broader structure.

 news.bitcoin.com