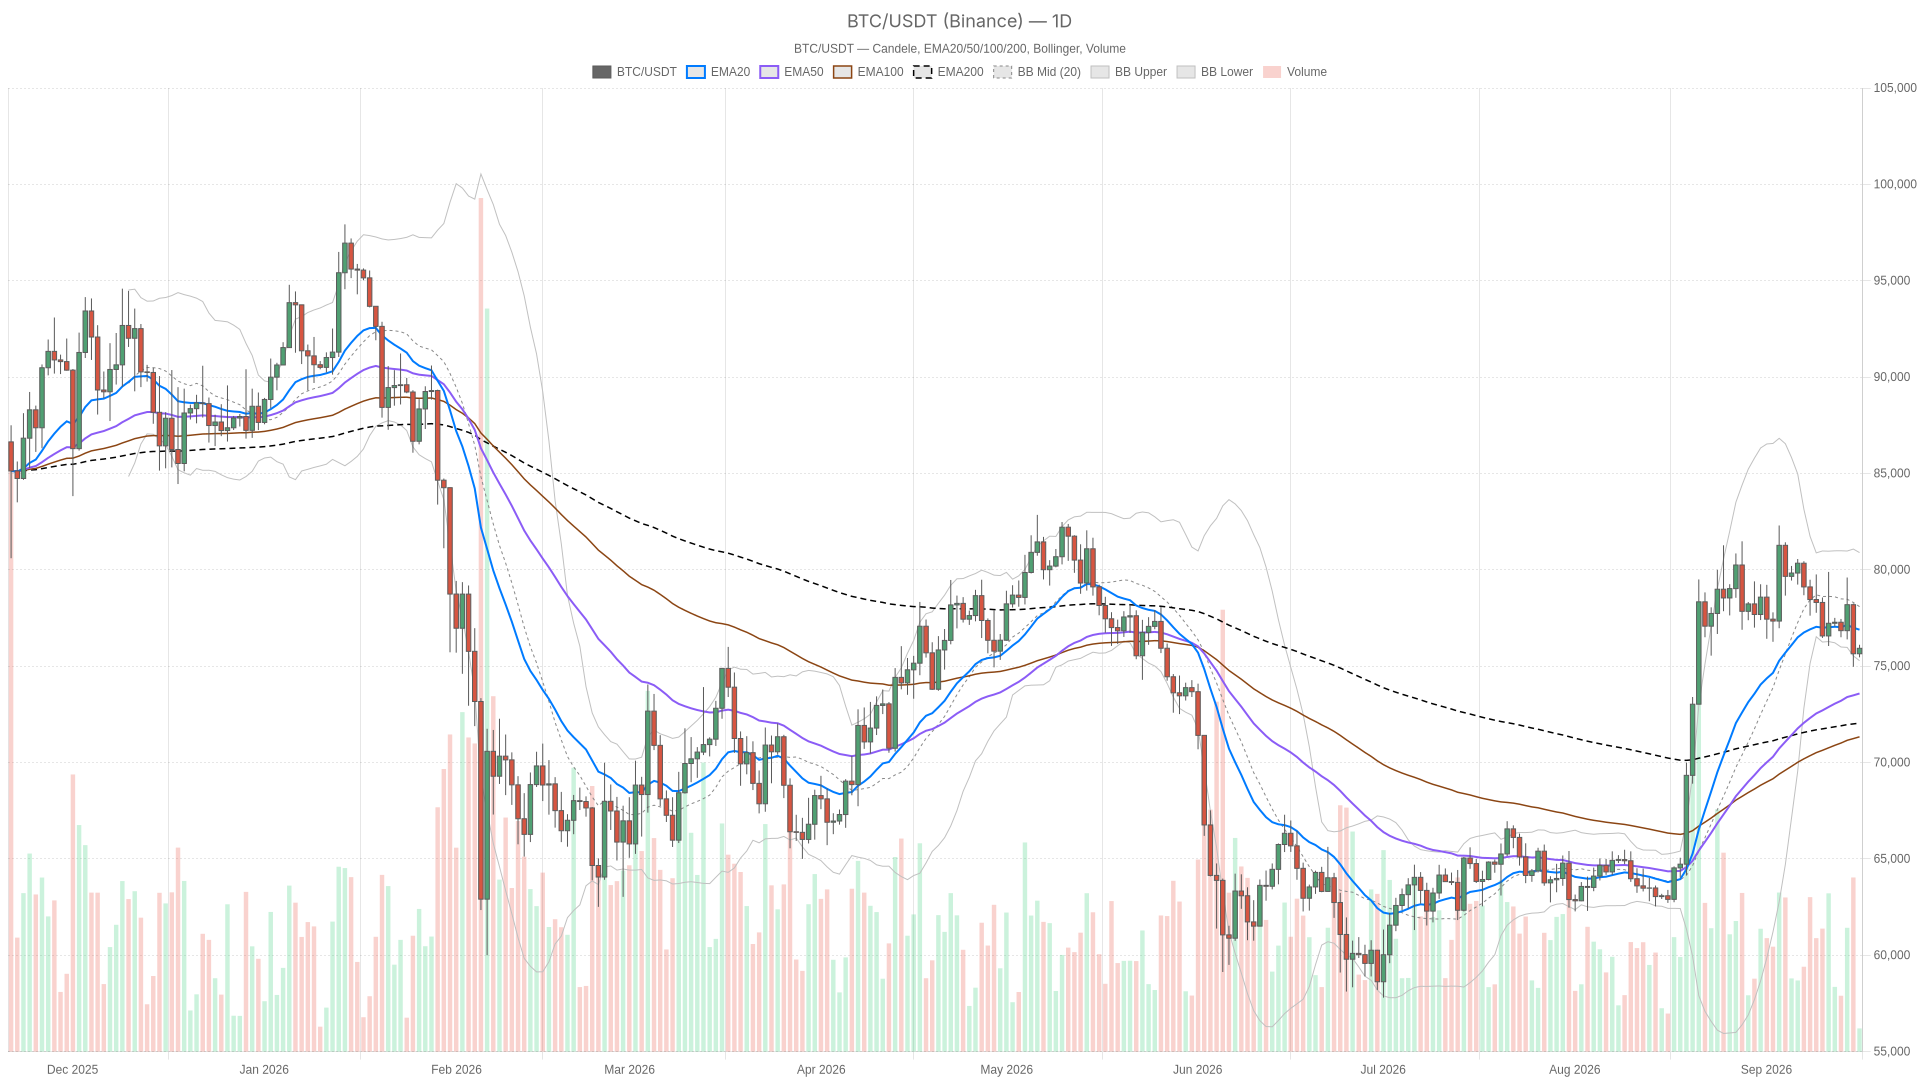
Daily Structure: Bitcoin Still Above Long-Term Averages
Bitcoin’s daily trend remains structurally intact. Price sits above the EMA50 ($73,581.64) and EMA200 ($72,042.87), confirming the medium- and long-term uptrend is still in place. However, price has slipped below the EMA20 ($76,891.81), meaning short-term momentum has already cracked even though the bigger trend has not.
RSI14 on the daily chart is at 49.26 — dead center, neither overbought nor oversold. That positioning signals the market has no strong conviction in either direction. Meanwhile, the MACD line (1003.27) remains above the signal’s prior positive territory, but the histogram has gone negative at -797.41 and the line has crossed below the signal (1800.67). This is the picture of a market losing steam rather than one collapsing — momentum decelerating inside an uptrend, not reversing outright.
The Bollinger Bands reinforce that interpretation. With the mid-band at $78,088.6, the upper band at $80,893.42, and the lower band at $75,283.78, price has drifted into the lower third of the daily range without breaching it. Daily ATR14 of $2,163.62 confirms volatility is elevated, so swings of that magnitude should not be dismissed as noise. Price ($75,926.01) is holding just above the daily pivot ($75,831.51), with resistance at R1 ($76,205.5) and support at S1 ($75,552.02) — a tight, undecided zone.
Hourly Chart Confirms Bearish Pressure
The hourly chart has already flipped bearish. Price trades below all three key EMAs — the EMA20 ($76,162.11), EMA50 ($76,748.53), and EMA200 ($77,750.43) are all stacked above current levels, forming a textbook short-term downtrend. Moreover, RSI14 at 42.46 leans bearish without being oversold, leaving room for further downside before any stretched-condition bounce becomes likely.
The hourly MACD adds a subtle wrinkle. The line (-362.4) is still below the signal (-436.2), so the broader MACD posture remains negative. That said, the histogram has ticked positive to 73.8 — a small bullish crossover attempt unfolding inside an otherwise bearish setup. This is the kind of signal that appears when short-term buyers are trying to stall a decline rather than reverse it. The hourly pivot sits at $75,947.85, with resistance at R1 ($76,075.7) and support at S1 ($75,798.16), a narrow band that is effectively boxing price in.
15-Minute Chart: Execution Context Only
The 15-minute chart offers execution context rather than a directional bias. It is neutral overall and compressed, making it more useful for timing entries than for reading the broader trend. RSI14 at 51.43 is mildly constructive, and the MACD histogram is positive at 6.58, hinting at a short-lived intraday bounce attempt. The EMA20 ($75,900.04) sits just under the EMA50 ($75,978.42), while both remain below the EMA200 ($76,765.24). The 15-minute pivot sits at $75,910 with R1 at $75,944.01 and S1 at $75,892 — a very tight range that reflects the broader stalemate rather than resolving it.
What Would Flip the Bias
Reclaiming the daily EMA20 would flip the bias back to bullish. If buyers can push through the daily R1 at $76,205.5 and retake the EMA20 near $76,891.81, that opens a path back toward the Bollinger mid-band at $78,088.6. For this scenario to even begin, however, the hourly chart would need to invalidate its own bearish regime. A close back above the H1 EMA20 ($76,162.11) and EMA50 ($76,748.53) would be the first real sign that the pullback is over rather than extending.
The bearish case is equally straightforward. A daily close below S1 ($75,552.02) and through the lower Bollinger Band ($75,283.78) would confirm that the pullback is turning into something more structural. The next real reference points would be the daily EMA50 at $73,581.64 and, beyond that, the EMA200 at $72,042.87. The hourly regime already supports this scenario since price is stacked below all three EMAs there. Moreover, losing the 15-minute pivot support at $75,892 with volume would confirm that intraday buyers have given up defending the zone.
Positioning and Risk
Right now, Bitcoin price today reflects a market that has not made up its mind. The daily trend structure has not broken, but the momentum indicators and the entire hourly timeframe are leaning against the bulls. Layer on a broader market that shed 4.70% of its total capitalization in a single day and a political catalyst — the Clarity Act and midterm outcome risk flagged by CNBC — sitting in the background, and this is not an environment to treat as one-directional. Daily ATR above $2,100 means volatility is real, and a Neutral Fear & Greed reading of 51 suggests there is no crowd extreme to fade in either direction yet. The sensible approach is to let the pivot levels and EMA reclaim or loss points do the talking rather than assuming either scenario is the default outcome.
FAQ
What is the Bitcoin price today?
As of September 16, 2026, Bitcoin is trading at $75,926.01. The total crypto market capitalization is down 4.70% over the past 24 hours, with $BTC dominance at 58.49%.
Is Bitcoin in an uptrend or a downtrend right now?
It depends on the timeframe. The daily chart shows an intact uptrend with price above the EMA50 and EMA200, while the hourly chart has already turned bearish with price below all three key EMAs. This divergence is the central tension in the market right now.
What are the key levels to watch?
On the upside, reclaiming the daily EMA20 at $76,891.81 and the daily R1 at $76,205.5 would be a bullish signal. On the downside, a close below S1 at $75,552.02 and the lower Bollinger Band at $75,283.78 would suggest a deeper correction toward the EMA50 at $73,581.64.
What does the Fear & Greed Index say about current sentiment?
The index reads 51, squarely in Neutral territory. This indicates the market has not capitulated despite the 24-hour drawdown, and there is no extreme sentiment to fade in either direction.
Disclaimer: This article is for informational purposes only and does not constitute financial advice, an investment recommendation, or a solicitation to buy or sell any financial instrument or cryptocurrency. The analysis provided is not indicative of future results. Investing in crypto assets and financial markets carries a high risk of capital loss. Always do your own research (DYOR) and consult a qualified financial advisor before making any decision.
Article produced with the assistance of artificial intelligence and reviewed by the editorial team.

 en.cryptonomist.ch